DELL 6-day bearish forecast — Nov 15, 2026
- Bias: Bearish
- Timeframe: 6 days (made Nov 15, 2026, target date Nov 20, 2026)
- Price at analysis: $344.38
- Price target: $336.00
- Expected range: $323.00 – $350.00
- Result: Pending — graded after the close on Nov 20, 2026
Get a free AI analysis of DELL today
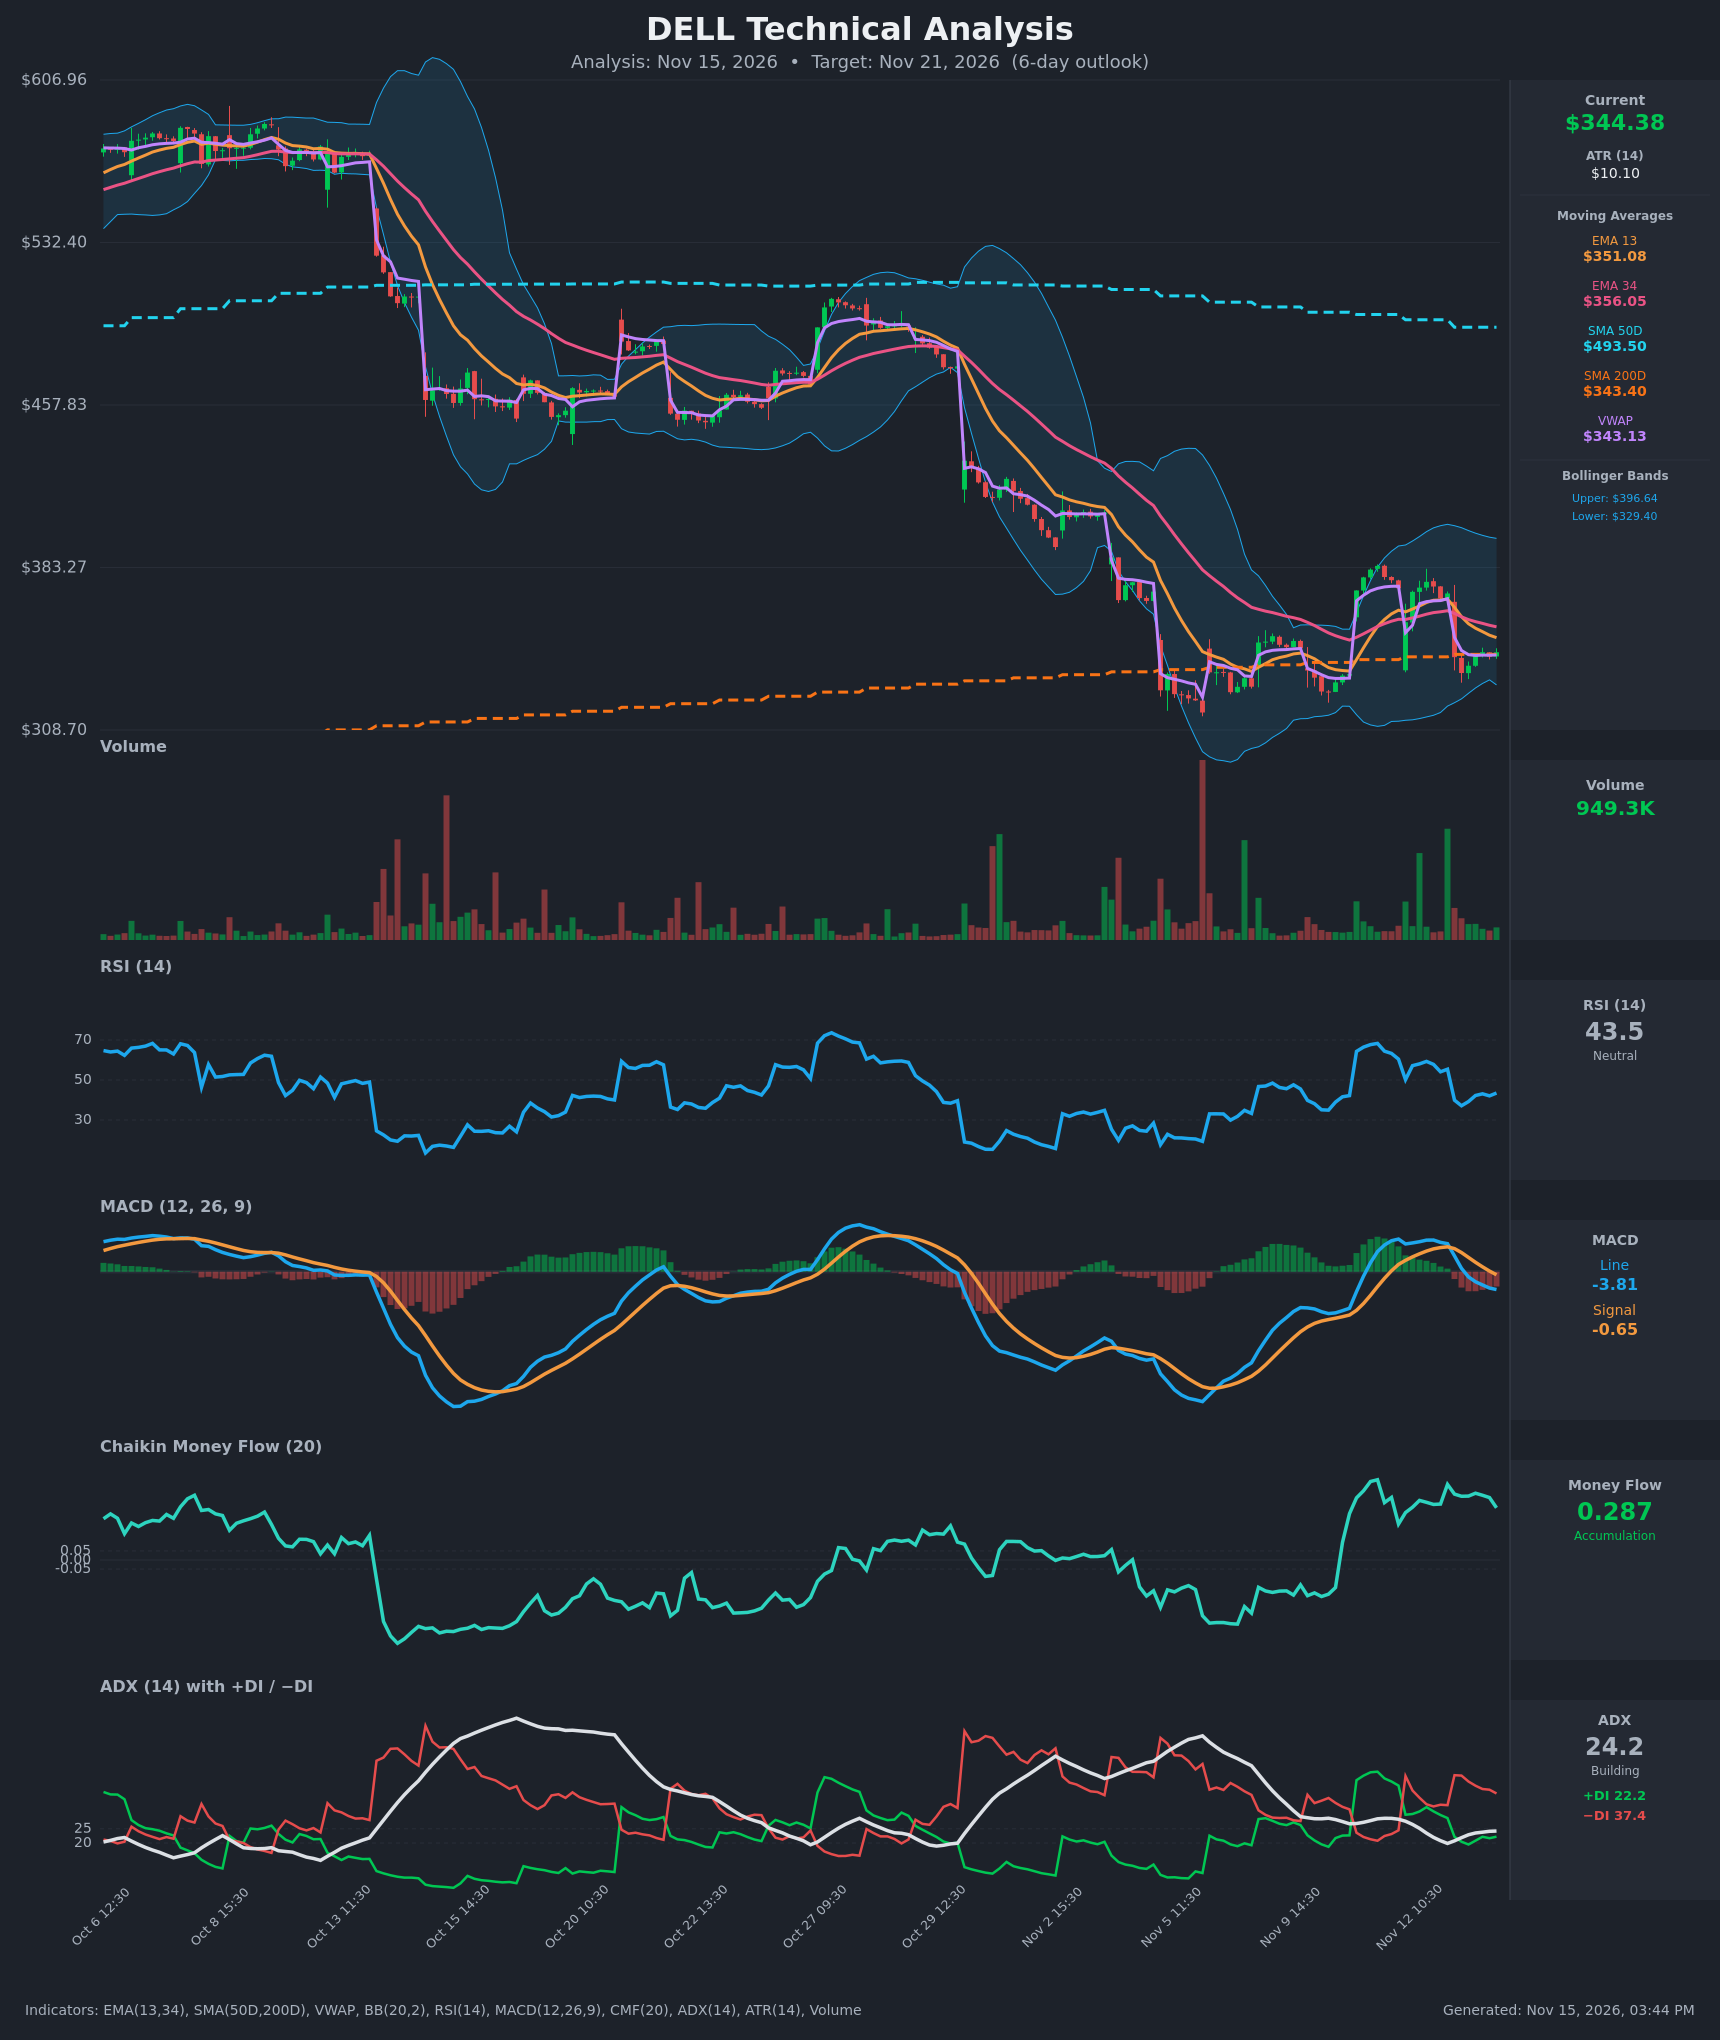
Analysis
TECHNICAL INDICATORS
- RSI (14): 43.48, below the 50 midline and recovering slightly from a drop to ~37 on Nov 13. It is not oversold, and momentum is soft after falling from 59 on Nov 12. [Bearish]
- 20 EMA (EMA 13 / EMA 34 used): EMA13 is $351.08 and EMA34 is $356.05. Price at $344.38 is below both, and EMA13 is now below EMA34 after crossing down on Nov 13 midday. Both act as overhead resistance. [Bearish]
- MACD: The line is -3.81 and the signal is -0.65, so the line crossed below the signal on Nov 13 (around 11:30) and is now negative. The histogram is negative (~-3.2) and widening, which means bearish momentum is building. [Bearish]
- Bollinger Bands (20): Upper is $396.64 and lower is $329.40, with price at $344.38 in the lower half of the band, about 22% of the way from the lower band. The bands are wide, which reflects the recent volatility spike. There is no squeeze, and price is drifting toward the lower band. The midline is near ~$363, which is overhead resistance. [Bearish]
- CMF (20): 0.287, well above +0.05. It has been sustained and elevated since Nov 5, and it dipped slightly from 0.416. This is accumulation under the surface despite the price drop, a notable bullish offset. [Accumulation]
- ADX (14): 24.2 and rising, near the 25 trend threshold. −DI at 37.4 sits well above +DI at 22.2, so bears are in control. The trend is building to the downside. [Moderate-to-Strong Trend, Bearish]
- Volume: 949.3K on the latest bar, which is modest and unremarkable versus the spikes on the Nov 5 flush and the Nov 12 selloff. The drop on Nov 13 had no capitulation volume, so it is not a clear exhaustion signal. [Neutral]
Other moving-average context:
- SMA200D is $343.40 and price is sitting right on it ($344.38), so this is the decisive long-term support test.
- SMA50D is $493.50, far above price. This is a deeply bearish long-term structure (price about 30% below it), and the declining 50D confirms the downtrend.
- VWAP is $343.13. Price is hugging it, which points to balanced intraday positioning.
DIVERGENCES & TRENDS
- CMF vs. price: There is a bullish divergence. CMF is high (0.287) while price fell from $373 to $344, which suggests dip-buying and accumulation. It is a potential support factor but has not yet turned price.
- Trend: The larger trend is down. Price fell from ~$570 to ~$345 over October and November through step-down gaps (the Oct 13 and Oct 29 gaps) and lower highs.
- Bearish crossovers: EMA13 crossed below EMA34, MACD crossed below its signal, and −DI crossed back above +DI on Nov 13 after the gap-down from $371 to $342.
- Price vs. SMA200D: Price is testing the 200D (~$343.40). It has held this area as support since Nov 5 (lows around ~$312–$320 showed a failed break below it), so the level is a pivot.
- RSI: RSI has made a lower high (~59 vs ~68 earlier), which is consistent with fading momentum.
CHART PATTERNS
- Descending Triangle / lower-high structure (bearish continuation): Lower highs in the EMA stack and the Nov 12 rejection at ~$376 sit against horizontal support at the SMA200D ($343) and the ~$330 area. A break below would target roughly the Nov 5 lows near $312–$320.
- Bearish Pennant/Flag-like consolidation: After the sharp drop, price has been consolidating in a small range of $335–$345 on Nov 13. A downside break projects a measured move to roughly $325–$330.
- Possible Bullish Double Bottom (lower probability): The Nov 5 low (~$312) and the Nov 13 low (~$335) form a higher-low base, supported by strong CMF. Confirmation would require a close above ~$376, which is far away and not yet confirmed.
The bearish continuation read has more evidence for the 6-day horizon.
POTENTIAL SCENARIOS
- Scenario 1: Bearish Break Below the SMA200D — Price loses the $343 SMA200D and VWAP, with −DI dominance and a negative MACD pushing toward the lower Bollinger Band and the prior low zone. Trigger: a close below $340 on rising volume. Target: $325–$330, with an extension to $315. Invalidation: a close above $352 (EMA13). (50% probability)
- Scenario 2: Neutral Chop Around the 200D — Price stays pinned between $335 and $352 as CMF accumulation offsets bearish trend indicators. Trigger: failure to break either $335 or $352 on a closing basis. Target: $340–$348. Invalidation: a close outside $333–$356. (22% probability)
- Scenario 3: Bullish Relief Bounce — The CMF accumulation drives a bounce off the SMA200D toward the EMA34 and Bollinger midline. Trigger: a close above $352 with MACD histogram contraction. Target: $356–$364. Invalidation: a close below $335. (28% probability)
PRICE TARGETS
Timeframe: 6 days (this falls in the 4–8% range-width band, so I used ~7%).
- Target Price: $336.00
- Expected Range: $323.00 to $350.00 (width $27, or ~7.8% of the $344.38 current price, consistent with the 6-day guidance)
- Key Levels: Support at $329.40 (lower Bollinger Band, near the prior low zone), Resistance at $351.08 (EMA13, with EMA34 at $356.05 above)
OVERALL BIAS
OVERALL BIAS: BEARISH - Price is below the EMA13 and EMA34 with a bearish MACD crossover, −DI (37.4) well above +DI (22.2), and ADX rising toward 25, with a death-cross-style structure under a far-above SMA50D. Strong CMF accumulation and the SMA200D support at ~$343 temper conviction, so expect a modest drift lower rather than a collapse.
This is educational analysis and not financial advice.