DELL 4-day bearish forecast — Nov 15, 2026
- Bias: Bearish
- Timeframe: 4 days (made Nov 15, 2026, target date Nov 18, 2026)
- Price at analysis: $344.38
- Price target: $338.50
- Expected range: $330.00 – $347.00
- Result: Pending — graded after the close on Nov 18, 2026
Get a free AI analysis of DELL today
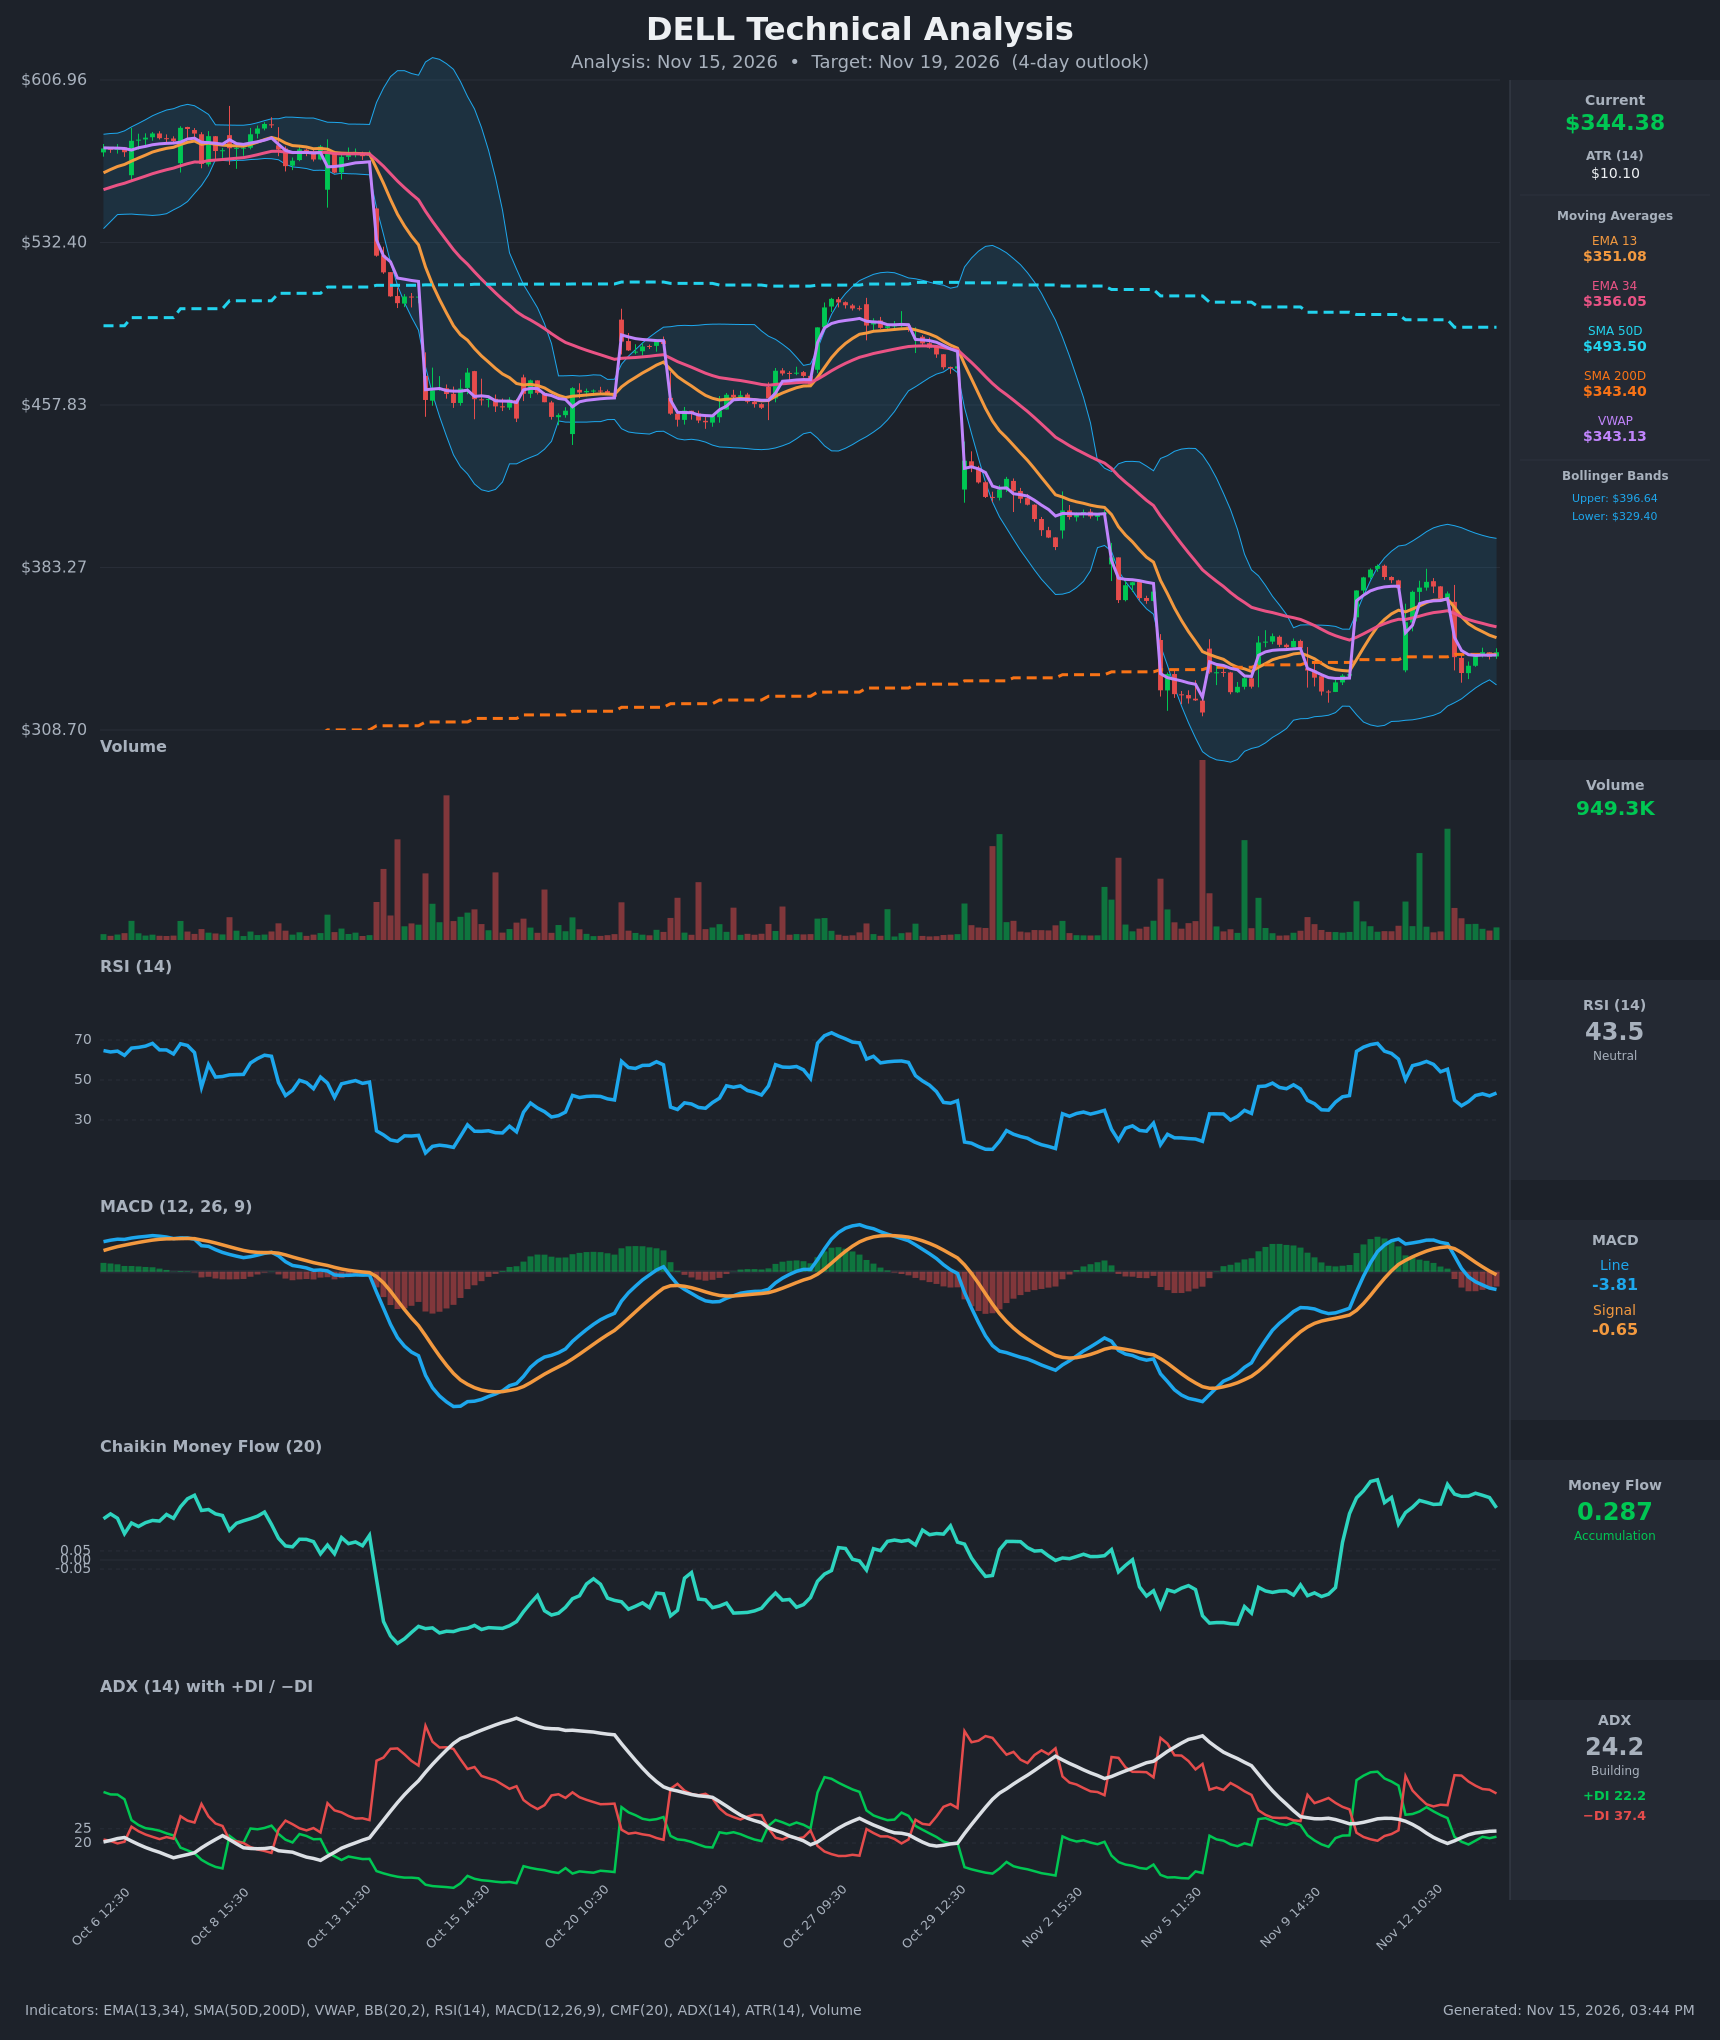
Analysis
TECHNICAL INDICATORS
- RSI (14): 43.48, below the 50 midline but well above oversold. It has rolled over from 59 on Nov 12 to a low of 37 and is only partially recovering. Momentum is soft with no oversold bounce signal. [Bearish]
- 20 EMA: The chart shows EMA 13 at $351.08 and EMA 34 at $356.05. Price at $344.38 is below both, and both are sloping down. EMA 13 is below EMA 34 and the gap is widening. They act as overhead resistance. [Bearish]
- MACD: The line at -3.81 crossed below the signal at -0.65 on Nov 13 and is below zero. The histogram is negative and expanding, so downside momentum is building. [Bearish]
- Bollinger Bands (20): Upper $396.64, lower $329.40, midline roughly $363. Price is in the lower half, about 22% of the band width above the lower band. The bands are fairly wide, so volatility is elevated. A drift toward the lower band is possible, but there is no squeeze or breakout. [Neutral]
- CMF (20): 0.287, well above +0.05. Accumulation has been sustained since the Nov 6-9 jump, but it is fading from the 0.42 peak. This is the main bullish counterweight. [Accumulation]
- ADX (14): 24.2 and rising slightly, just under the 25 trend threshold. −DI at 37.4 is far above +DI at 22.2, so bears control the trend. A DI crossover to the upside is unlikely in the near term. [Moderate/Building Trend – Bearish]
- Volume: 949.3K, ordinary and well below the spike bars seen on the Nov 5-6 flush and the Nov 10 rally. The Nov 13 drop has not been followed by capitulation volume, so there is no clean exhaustion signal either way. [Neutral]
DIVERGENCES & TRENDS
- Price is holding around the SMA200 ($343.40) and VWAP ($343.13) while MACD and the DI lines deteriorate. This is a modest divergence between price support and momentum.
- CMF is strongly positive while price makes lower highs ($385 → $377). Buying pressure is not translating into higher prices, which suggests supply is absorbing the bids at the highs.
- EMA 13 is below EMA 34, a bearish alignment, and the gap is widening.
- The SMA50D at $493.50 is far above the SMA200D at $343.40. That is a prior death-cross structure, and the long-term trend remains damaged. Price is only just above the SMA200, so a loss of it would be significant.
- The Nov 13 gap-down from $371 to $342 broke the recent range. Price has since consolidated flat around $342-344.
CHART PATTERNS
- Bearish Double Top (loose): Highs near $385 and $377 with a neckline around $334-335, the Nov 13 low. A close below the neckline projects a measured move of roughly $40-50. This is well beyond a 4-day horizon, but it points to downside risk.
- Bearish Flag / Pennant (consolidation): The tight sideways action at $342-345 after the sharp drop resembles a bearish flag. A downside break is the continuation case.
- Counter-view: Price is sitting on SMA200 and VWAP just above the lower band, and a reclaim of $351 would invalidate the bearish reading.
POTENTIAL SCENARIOS
- Scenario 1: Bearish Continuation Below SMA200 — Price loses the SMA200/VWAP cluster at about $343, with MACD and −DI dominance driving a test of the Nov 13 low and the lower Bollinger Band. Trigger: hourly close below $342 and then below $334.85. Target: $336-$330. Invalidation: hourly close above $351 (EMA 13). (50% probability)
- Scenario 2: Bullish Support Bounce — CMF accumulation and the SMA200 floor spark a relief bounce back to the EMA cluster. Trigger: reclaim of $351 on rising volume with the MACD histogram flattening. Target: $356-$363 (EMA 34 to the BB midline). Invalidation: close below $334.85. (33% probability)
- Scenario 3: Neutral Range Chop — Price pins between the SMA200 and the EMAs. Trigger: failed breaks on both sides. Target: $340-$348. Invalidation: a decisive move beyond $334 or $352. (17% probability)
PRICE TARGETS
- Target Price: $338.50 (4-day horizon, Nov 19)
- Expected Range: $330.00 to $347.00. Width is $17.00, about 4.9% of the current price, which fits a 4-day window. It is wider than a 2-3 day range and narrower than a 7-10 day range.
- Key Levels: Support at $329.40 (lower Bollinger Band; immediate minor support at the $343.40 SMA200 and $334.85 Nov 13 low), Resistance at $351.08 (EMA 13; next at $356.05 EMA 34)
OVERALL BIAS
OVERALL BIAS: BEARISH - MACD bearish crossover below zero, −DI far above +DI, and price below falling EMAs with lower highs outweigh the positive CMF. Price is balanced on the SMA200/VWAP, so a break lower is the more probable resolution over the next 4 days. Conviction is modest because of the strong CMF and the SMA200 support.
This is educational analysis and not financial advice.