IBM 4-day bullish forecast — Nov 15, 2026
- Bias: Bullish
- Timeframe: 4 days (made Nov 15, 2026, target date Nov 18, 2026)
- Price at analysis: $247.19
- Price target: $249.00
- Expected range: $242.80 – $252.60
- Result: Pending — graded after the close on Nov 18, 2026
Get a free AI analysis of IBM today
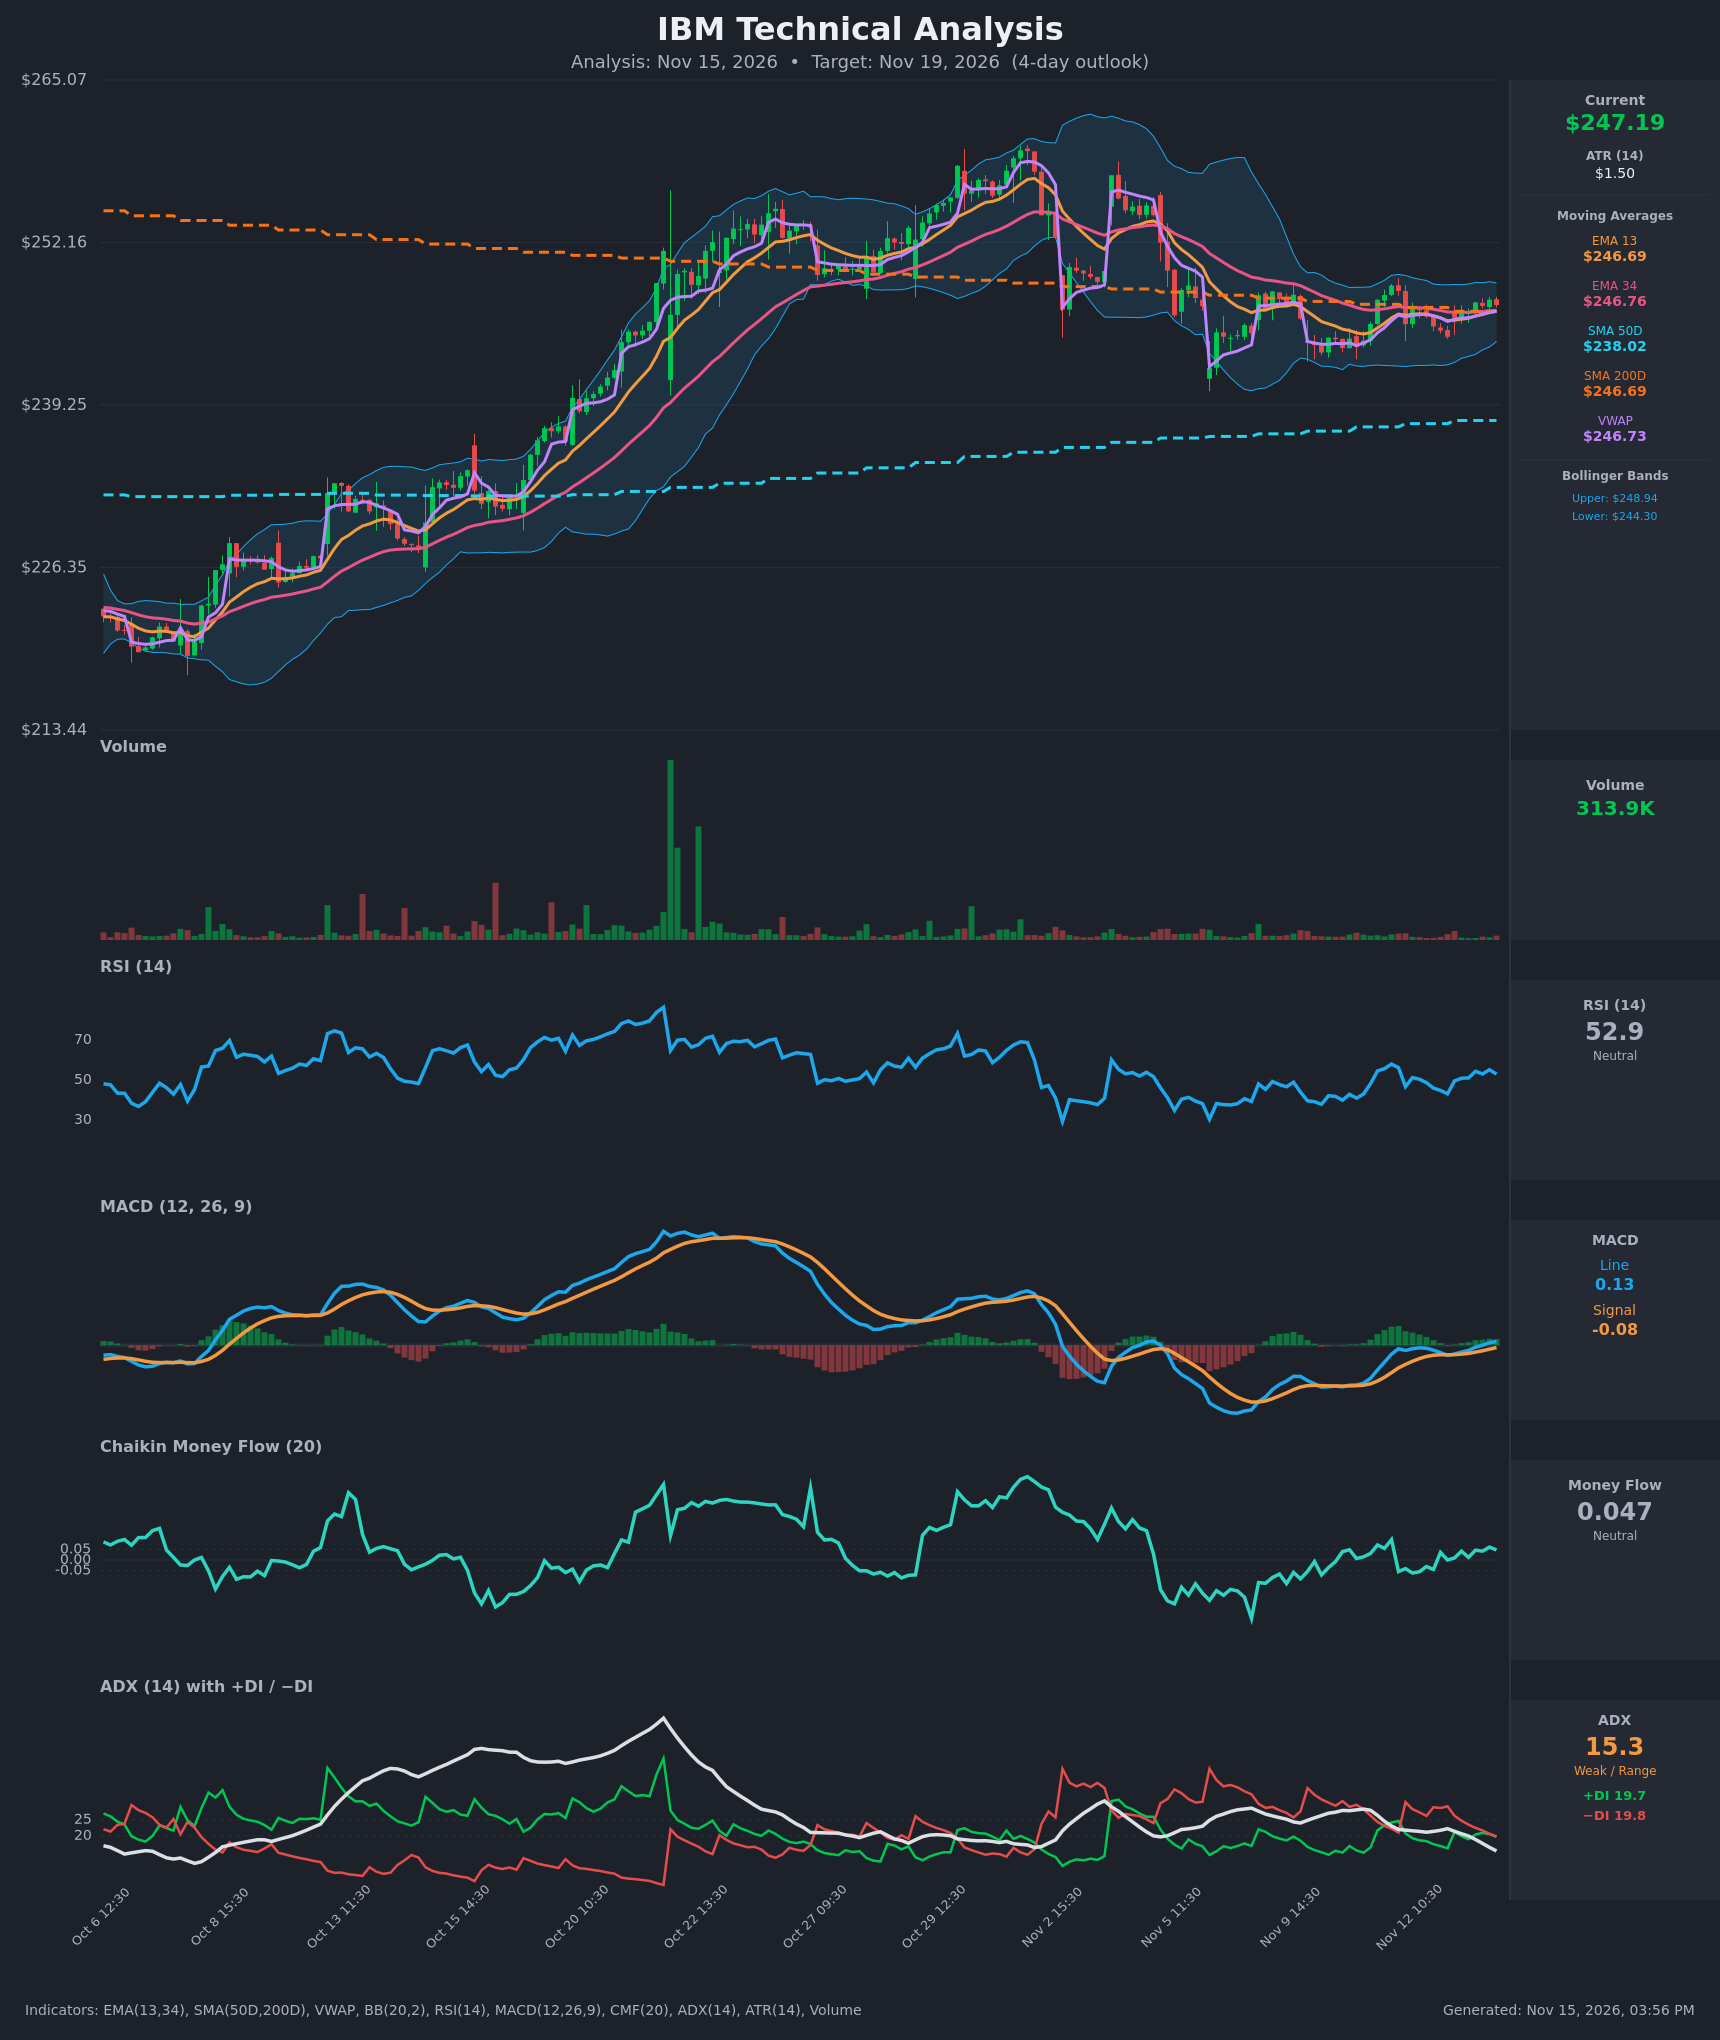
Analysis
TECHNICAL INDICATORS
- RSI (14): 52.92, just above the 50 midline. It has recovered from 43.1 (Nov 12 close) and is rising off a mid-range base, with no overbought or oversold condition. [Neutral]
- 20 EMA (EMA 13 / EMA 34 used): EMA 13 is $246.69 and EMA 34 is $246.76. Price at $247.19 is above both, so the short-term EMAs act as support. The EMAs are almost flat and nearly converged, with EMA 13 still marginally below EMA 34 (no bullish cross yet). [Bullish]
- MACD: The line (0.129) crossed above the signal (-0.085) on Nov 13, and the histogram has flipped from negative to positive. The cross is fresh and sits near the zero line, so it signals early momentum improvement rather than a strong trend. [Bullish]
- Bollinger Bands (20): Upper $248.94, lower $244.30, with the midline around $246.6. Price is in the upper half of the bands, and the bands are very narrow (a squeeze). That points to a volatility expansion ahead, with direction not yet confirmed. [Neutral]
- CMF (20): 0.047, just under the +0.05 accumulation threshold. It has turned from slightly negative to mildly positive over the last several bars, which shows modest buying pressure creeping in. [Neutral]
- ADX (14): 15.3 and falling, which means a weak trend or range-bound market. +DI (19.7) and −DI (19.8) are essentially tied after −DI dominated on Nov 12 (30.5 vs 20.7), so bears have lost control but bulls have not taken it. [Weak Trend, no direction]
- Volume: 313.9K, subdued compared with the heavy-volume breakout days in mid/late October. Low participation matches the consolidation and means a breakout needs a volume confirmation. [Neutral / low conviction]
DIVERGENCES & TRENDS
- No major price/indicator divergence. RSI and MACD have turned up with price off the $244.67 low, so momentum and price agree.
- MACD has moved from deeply negative in early November to a bullish cross, and the histogram is expanding positively.
- DI convergence: −DI has collapsed from 30.5 to 19.8 while +DI has risen from 16.1 to 19.7. A +DI/−DI bullish crossover is imminent, but ADX at 15 says it would be a weak signal.
- Moving-average cluster: Price, EMA 13, EMA 34, SMA 200D ($246.69), VWAP ($246.73) and the BB midline are all within about $0.10 of each other. This is a decision zone, and price is currently holding just above it.
- SMA 50D ($238.02) is well below price and still rising. There is no death cross, and the trend since early October remains up, though the advance has stalled since the $258 peak.
- VWAP: Price is above VWAP, which is mildly bullish.
CHART PATTERNS
- Primary read: a symmetrical-triangle / pennant-style consolidation. After the October rally and the early-November pullback, the range has contracted into a tight coil around $244–$249. The Bollinger squeeze and falling ADX support this. In the reference diagram this resembles the Symmetrical Triangle and, given the prior uptrend, the Bullish Pennant. The pattern is a continuation setup that can break either way.
- Bias within the pattern: The prior trend is up, price is above the 200D SMA, and momentum is turning up. That leans toward an upside break, but a close above $248.94 on better volume is needed to confirm.
- Targets: A measured breakout is roughly the pattern height (~$5) added to the breakout point, which gives about $253 on a decisive break. Over a 4-day window, a realistic move is toward $249–$251. A failure below $244.30 would open $242–$241.
POTENTIAL SCENARIOS
- Scenario 1: Bullish Squeeze Breakout Higher — The fresh MACD cross, rising RSI, positive CMF and price holding above the MA cluster lead to an upside break of the coil. Trigger: a close above $248.94 (upper BB) with rising volume. Target: $250.50–$252.00. Invalidation: a close back below $246.00, which loses the EMA/SMA200 cluster. (45% probability)
- Scenario 2: Neutral Continued Range-Bound Chop — With ADX at 15 and low volume, price keeps oscillating around the $246.70 MA cluster inside the Bollinger Bands. Trigger: no close outside $244.30–$248.94. Target: $245.50–$248.00. Invalidation: a decisive close outside the band range. (25% probability)
- Scenario 3: Bearish Failed Hold at the 200D SMA — Price loses the $246.69 cluster, −DI retakes the lead and the MACD cross fades. Trigger: a close below $245.50, then below $244.30. Target: $242.00–$243.00. Invalidation: a reclaim of $247.50 or higher. (30% probability)
PRICE TARGETS
- Target Price: $249.00 (4-day horizon, about +0.7%)
- Expected Range: $242.80 to $252.60 (width $9.80, about 4.0% of the current price, which fits the short-timeframe guidance)
- Key Levels: Support at $244.30, Resistance at $248.94
OVERALL BIAS
OVERALL BIAS: BULLISH - Price is above EMA 13/34 and VWAP with a fresh bullish MACD crossover, rising RSI and CMF turning positive, so the evidence tilts modestly upward. Conviction is modest because ADX is weak (15.3), the DI lines are tied and the Bollinger squeeze has not yet resolved.
This is educational analysis and not financial advice.