IBM 6-day bullish forecast — Nov 15, 2026
- Bias: Bullish
- Timeframe: 6 days (made Nov 15, 2026, target date Nov 20, 2026)
- Price at analysis: $247.19
- Price target: $249.50
- Expected range: $241.50 – $253.50
- Result: Pending — graded after the close on Nov 20, 2026
Get a free AI analysis of IBM today
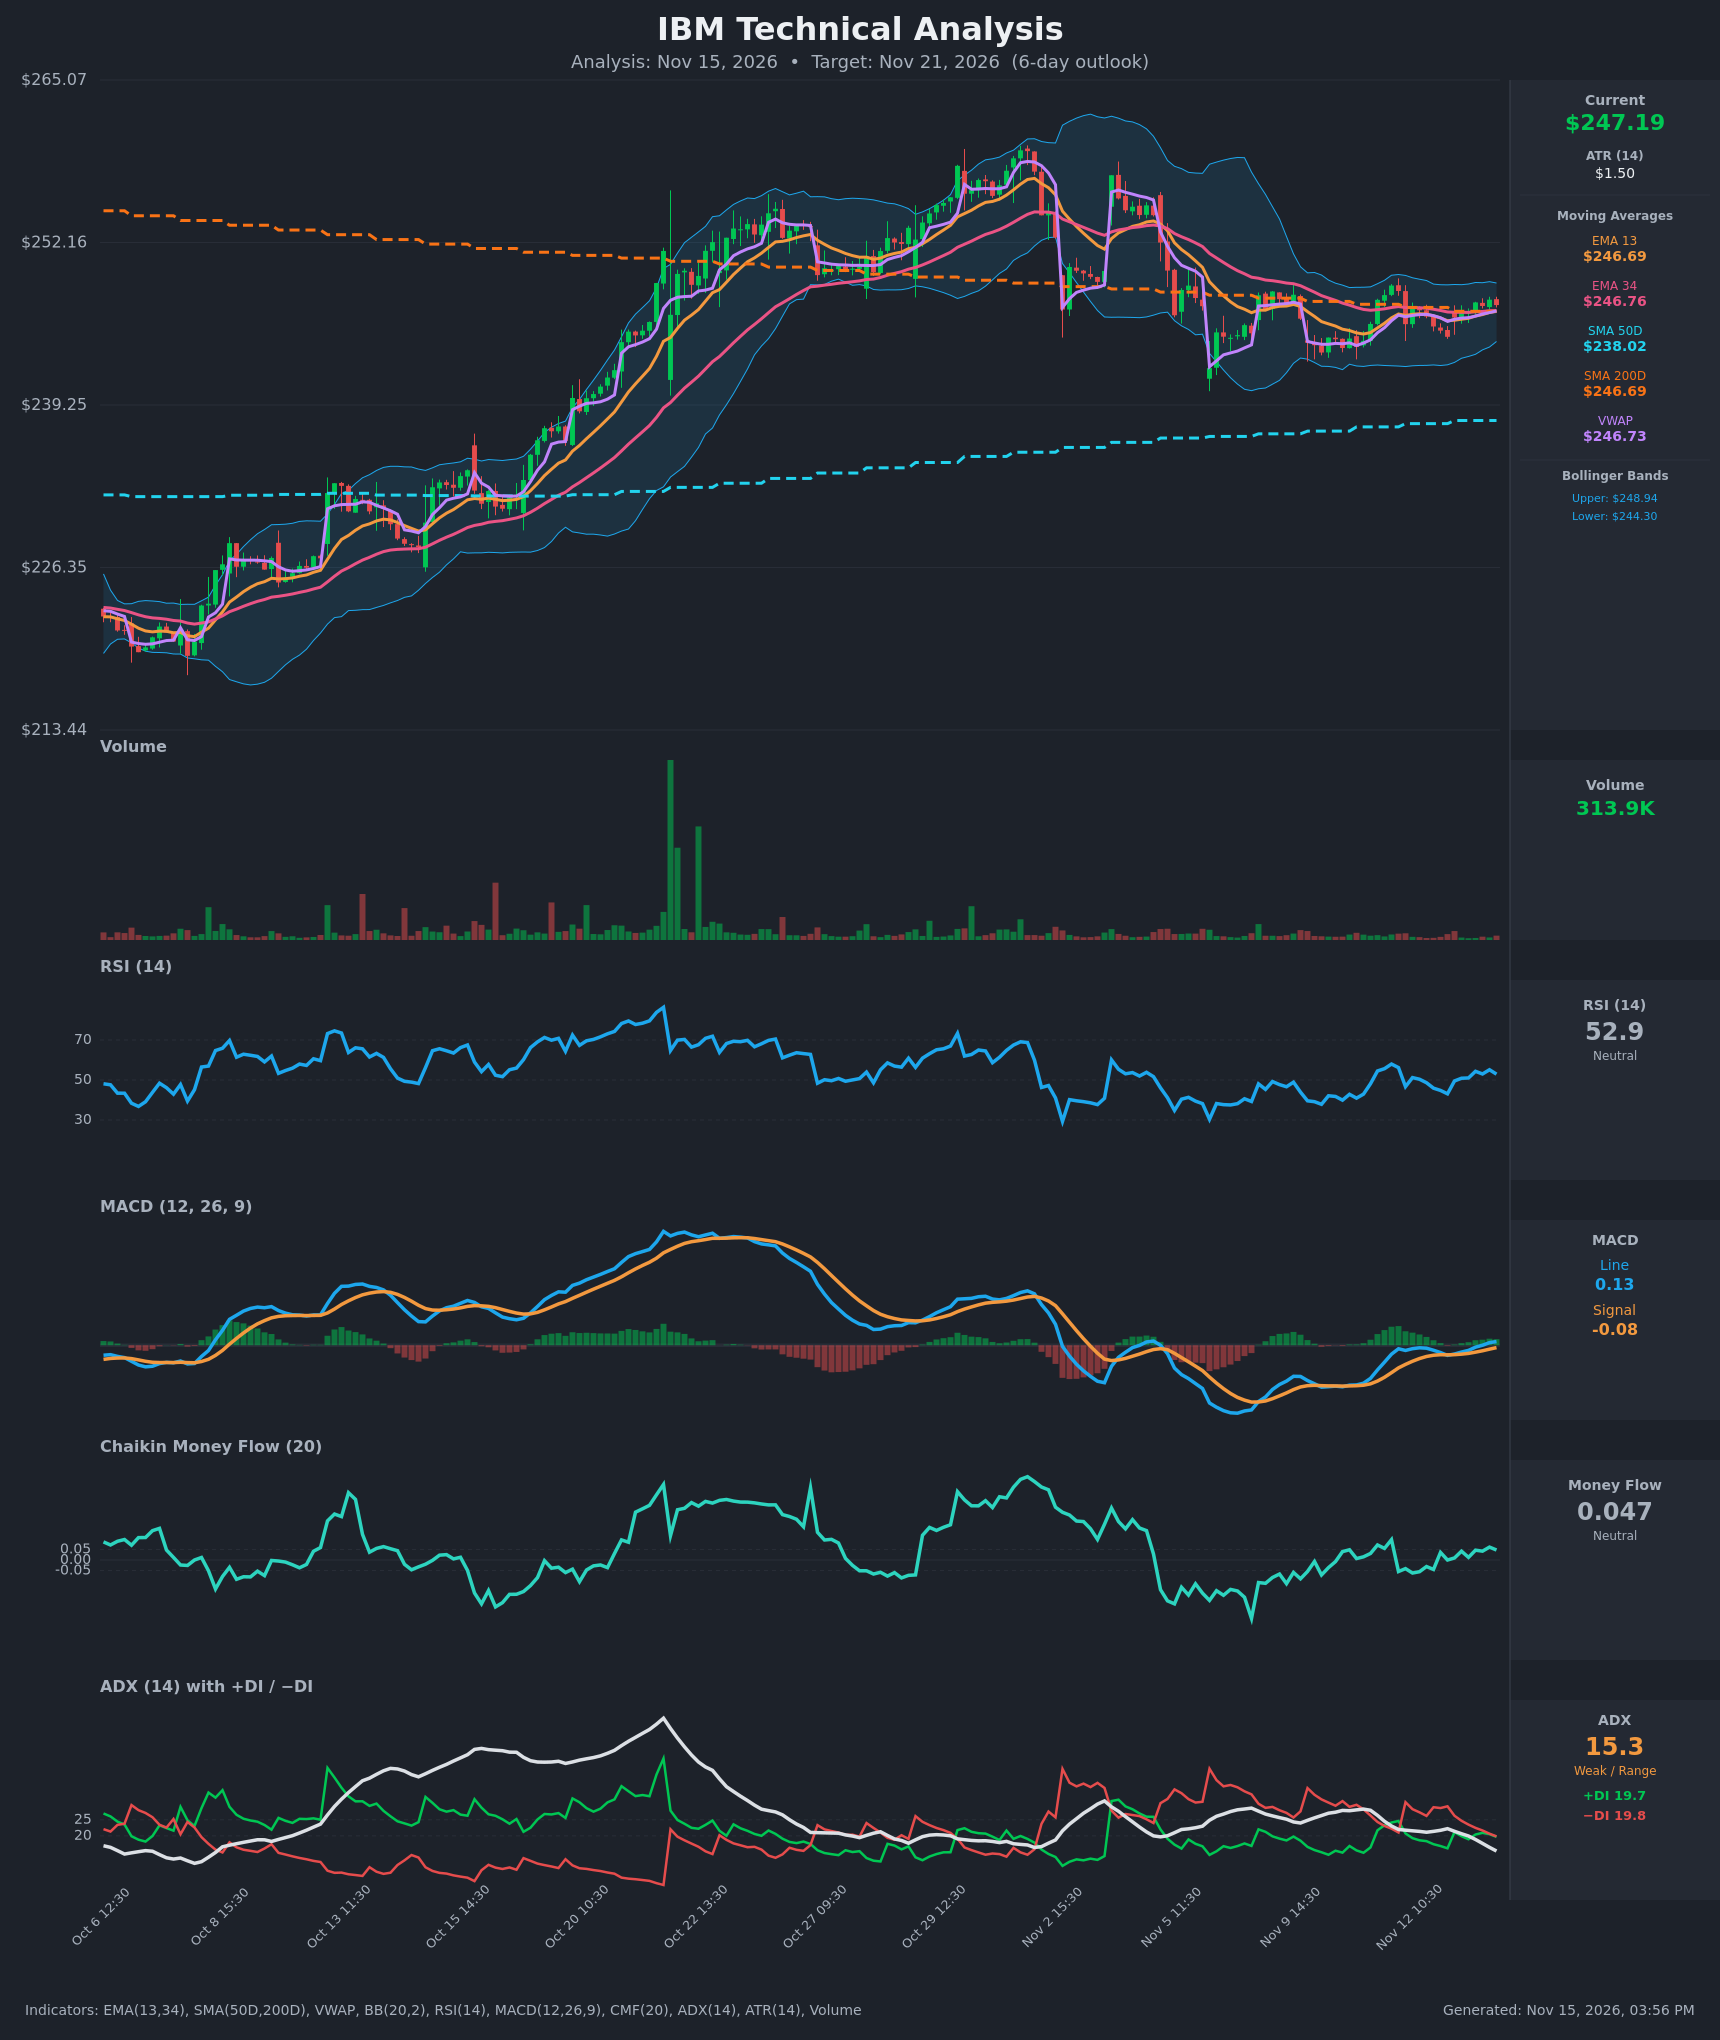
Analysis
TECHNICAL INDICATORS
- RSI (14): 52.92, near the midline. It has recovered from 43.1 on Nov 12 15:30 and is rising off the lows, but it is not yet showing strong momentum. [Neutral]
- 20 EMA (EMA 13/34 used): EMA13 is $246.69 and EMA34 is $246.76. Price at $247.19 is just above both. EMA13 has turned up from $245.95 and is now in line with EMA34, so a bullish crossover is close but not confirmed. The SMA200D at $246.69 and VWAP at $246.73 sit at the same level, which makes a tight support cluster just under price. [Bullish]
- MACD: The line is 0.129 and the signal is -0.085, so the line is above the signal. It crossed up around Nov 13 13:30 and the histogram has turned positive and is expanding, from -0.36 to +0.21. This is a fresh bullish crossover, but near the zero line it is a modest signal. [Bullish]
- Bollinger Bands (20): The upper band is $248.94 and the lower is $244.30. The bands are narrow (about $4.64 wide) after a clear contraction since early November, which is a squeeze that often comes before a volatility expansion. Price sits slightly above the midline (about $246.6), in the upper half of the bands. [Neutral]
- CMF (20): 0.047, just under the +0.05 accumulation threshold. It has risen from slightly negative readings (-0.06) to slightly positive, which is a mild improvement in buying pressure but not yet accumulation. [Neutral]
- ADX (14): 15.3 and falling, which signals a weak, range-bound market. +DI is 19.7 and −DI is 19.8, essentially tied. −DI dominated on Nov 12 (about 30) but the gap has closed, so bears have lost control without bulls taking over. [Weak Trend – no clear direction]
- Volume: 313.9K, low compared with the spikes seen in mid-October. Volume has been quiet during the recent consolidation, so there is no conviction yet in either direction. A breakout would need volume to confirm. [Neutral / Low participation]
DIVERGENCES & TRENDS
- Divergences: No major divergence. RSI and MACD rose in step with the bounce from the Nov 5 low (about $241), and price has not made a new high that the indicators failed to confirm.
- Trends:
- MACD histogram has turned positive and is rising.
- RSI has gone from 43 to 53.
- CMF has moved from negative to marginally positive.
- ADX is falling toward 15, so the trend is fading.
- Bollinger Bands are contracting.
- Crossovers and breaks:
- MACD crossed up through its signal line (bullish).
- Price reclaimed the EMA13, EMA34, VWAP and SMA200D cluster at about $246.7.
- +DI and −DI converged and are almost crossing.
- SMA50D ($238.02) is well below price and rising, so the longer-term structure is still constructive. There is no golden or death cross.
- Price sits right on the SMA200D, so the long-term trend is at a pivot point.
CHART PATTERNS
- Sideways consolidation / symmetrical triangle (squeeze): Since the Nov 5 low, price has moved in a tightening range of roughly $244–$249 with narrowing bands and a weak ADX. The pattern is a symmetrical triangle or coil, which is a continuation pattern in the direction of the prior move. The larger prior trend (rally from about $222 to $256) is up, which gives a slight upside edge. A breakout above $249 targets about $252–$253, and a break below $244 targets $241.
- Bearish double top (watch item): Highs near $255–$256 (late October) and about $253 (early November) resemble a double top, with a neckline near $241. It is not confirmed unless price breaks below $241, so it is a risk marker only.
- Bullish flag-like recovery: The pullback from $253 to $241 and the subsequent stabilization above the 200-day average resembles a flag after the earlier advance. This is a weak match.
POTENTIAL SCENARIOS
- Scenario 1: Bullish Squeeze Breakout — The MACD crossover and the reclaim of the MA cluster lead to an upside break out of the Bollinger squeeze. Trigger: close above $248.94 with rising volume and CMF above +0.05. Target: $251.50–$253.00. Invalidation: close back below $246.00 (under the SMA200D/EMA cluster). (45% probability)
- Scenario 2: Neutral Range Chop — Weak ADX keeps price rotating between the lower and upper bands without a decisive break. Trigger: failure to hold above $248.94 and failure to break below $244.30. Target: $245.50–$248.50. Invalidation: a decisive close outside the $244.30–$248.94 band. (33% probability)
- Scenario 3: Bearish Breakdown — Buyers fail at resistance, −DI retakes the lead and price loses the 200-day average and the lower band. Trigger: close below $244.30 on rising volume. Target: $241.00–$242.00 (the Nov 5 low). Invalidation: reclaim of $247.50 with a MACD histogram that keeps rising. (22% probability)
PRICE TARGETS
- Target Price: $249.50 (6-day)
- Expected Range: $241.50 to $253.50 (width $12.00, about 4.9% of current price, in line with the 6-day timeframe)
- Key Levels: Support at $244.30 (lower Bollinger Band; $246.69 SMA200D/EMA13 is the first minor support), Resistance at $248.94 (upper Bollinger Band; the $252–$253 prior swing area is next)
OVERALL BIAS
OVERALL BIAS: BULLISH - A fresh bullish MACD crossover, price reclaiming the EMA13/34, VWAP and SMA200D cluster, CMF improving toward accumulation and a rising SMA50D give a modest edge to the upside from a Bollinger squeeze. Conviction is limited by the weak ADX (15.3) and the balanced DI readings.
This is educational analysis and not financial advice.