CRWV 34-day bullish forecast — Nov 15, 2026
- Bias: Bullish
- Timeframe: 34 days (made Nov 15, 2026, target date Dec 18, 2026)
- Price at analysis: $53.13
- Price target: $55.80
- Expected range: $49.50 – $59.00
- Result: Pending — graded after the close on Dec 18, 2026
Get a free AI analysis of CRWV today
Analysis
TECHNICAL INDICATORS
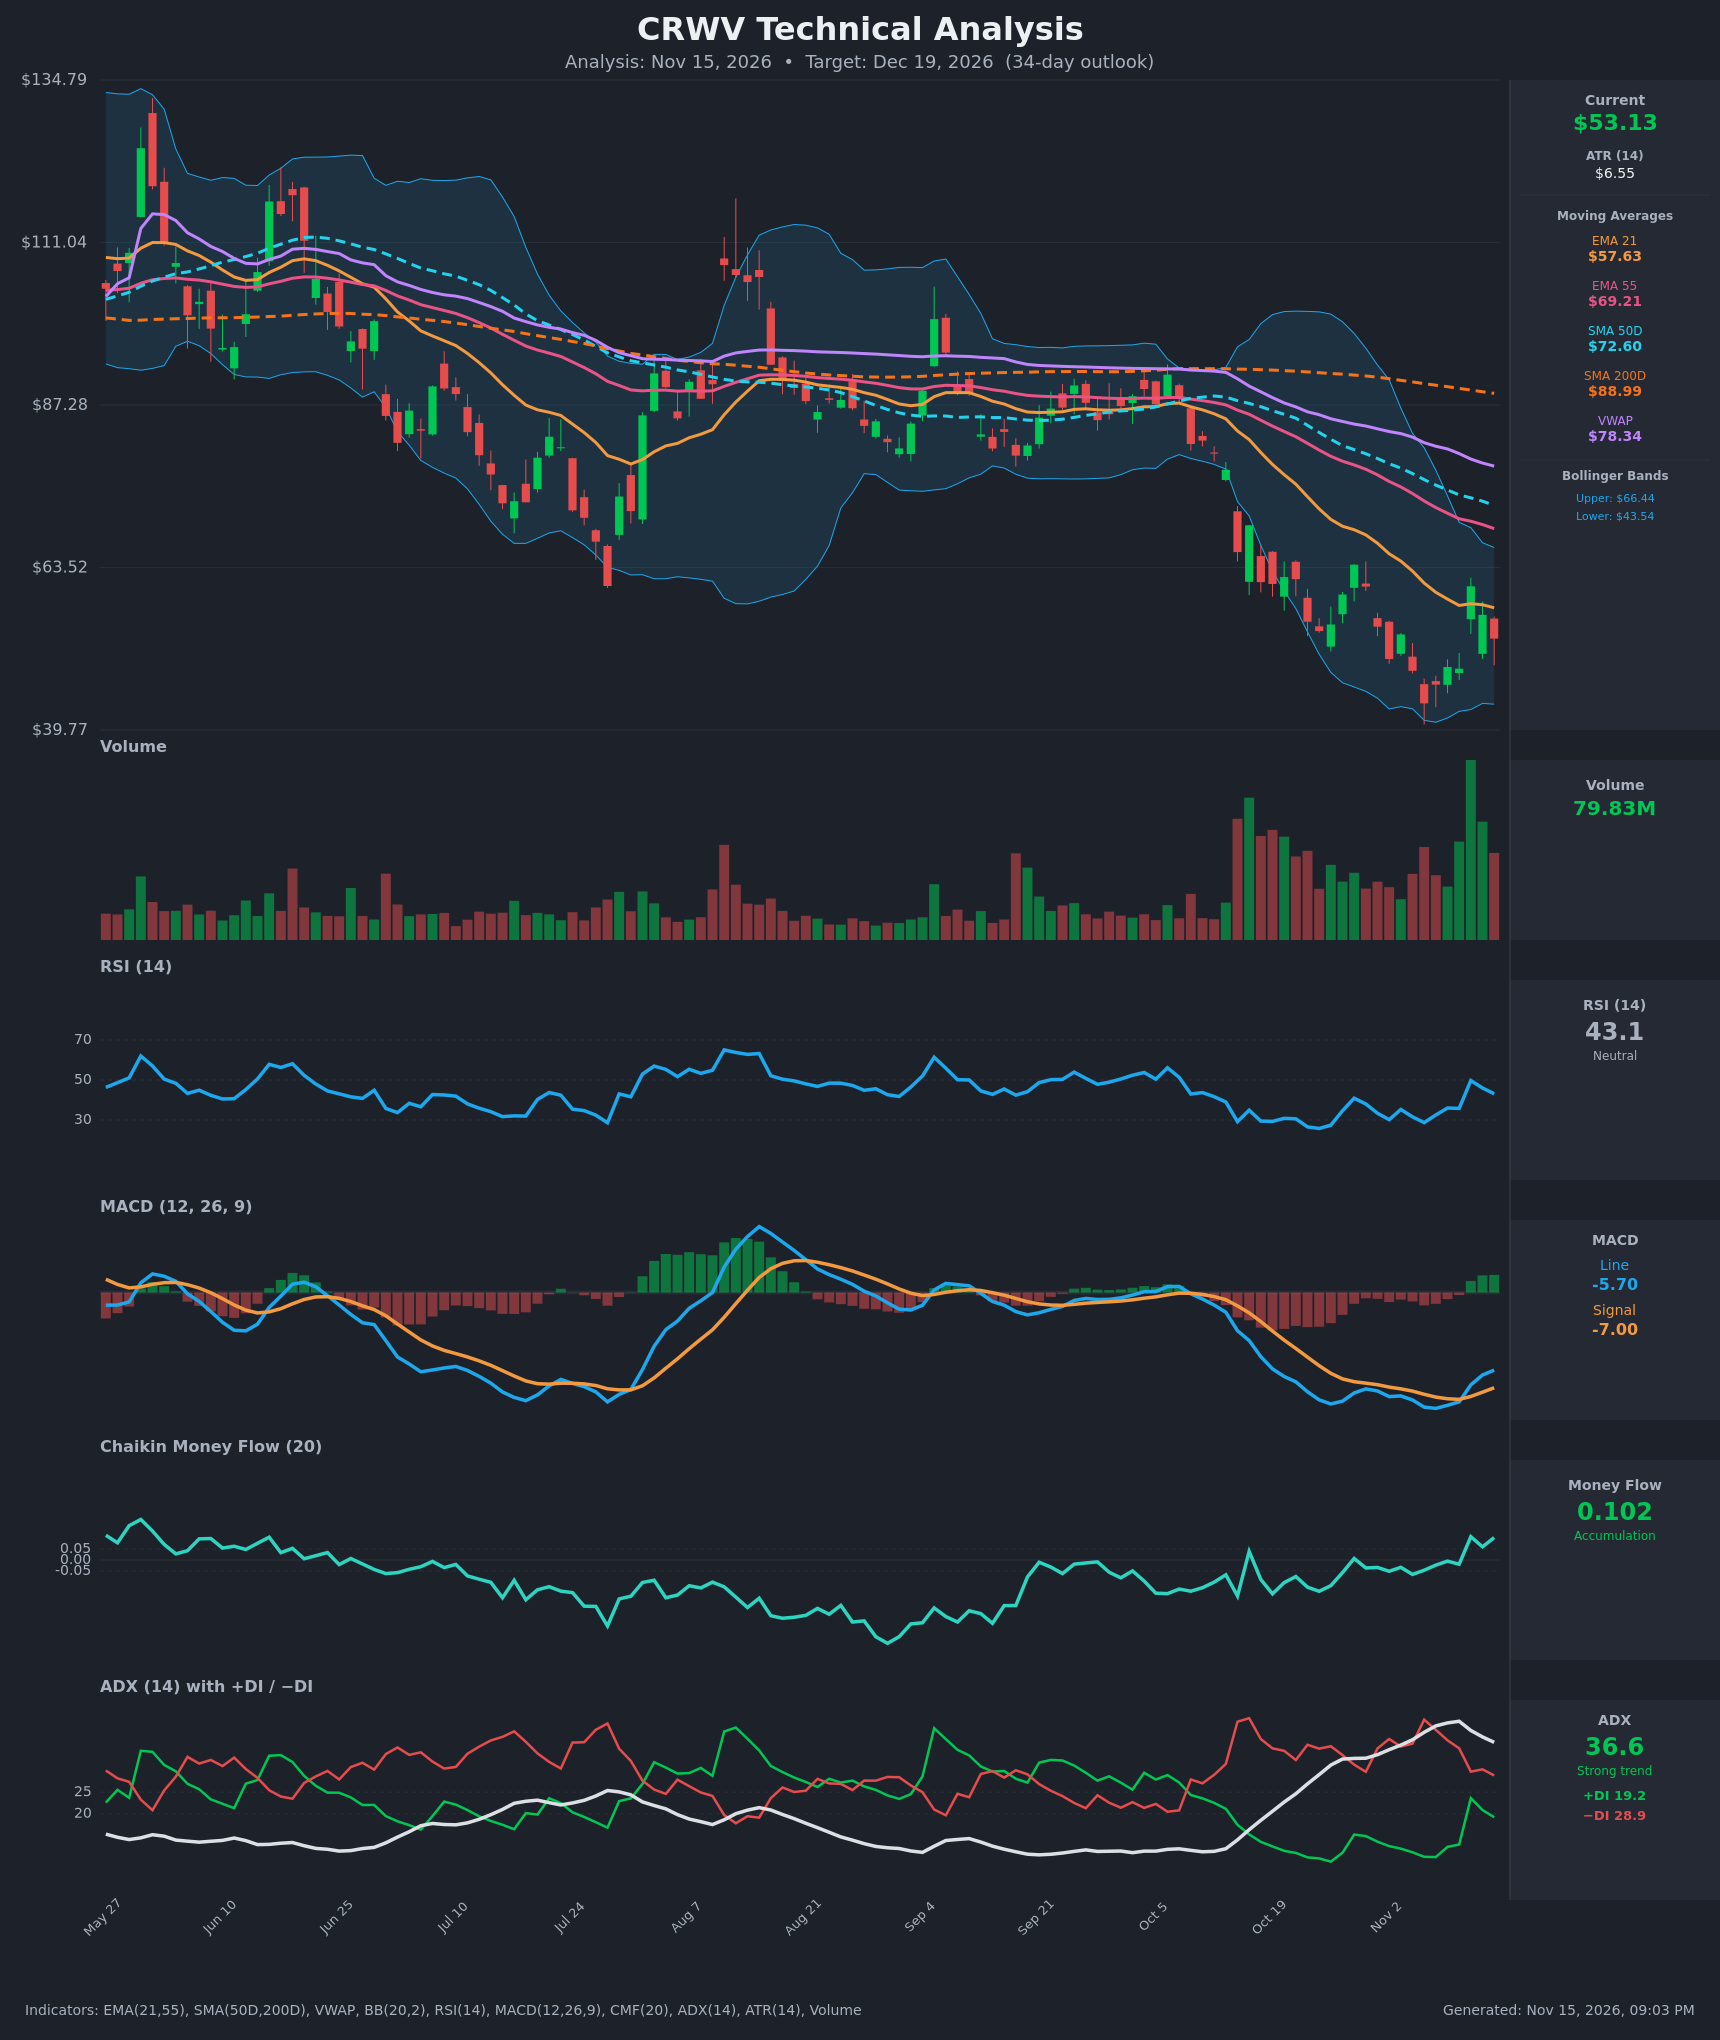
- RSI (14): 43.11, up from the 28.7 oversold low on Nov 5 and a 49.7 peak on Nov 11. It has faded the last two sessions with price. Momentum has recovered from oversold but is still below 50. [Neutral]
- 20 EMA: The EMA 21 is $57.63 and falling, with price at $53.13 below it. EMA21 is below EMA55 ($69.21), which is below SMA50D ($72.60). The stack is fully bearish, and EMA21 is the first overhead resistance. [Bearish]
- MACD: The line is -5.70 against a signal of -7.00, so the histogram is positive. A bullish crossover occurred around Nov 11 and the line has kept rising. It is still deep below zero, so this is a relief signal, not a trend reversal. [Bullish]
- Bollinger Bands (20): The bands run $43.54 to $66.44 (midline about $55). Price touched the lower band at the $43.66 low on Nov 5 and has bounced to the lower half of the range. The bands are still wide after the selloff, with the midline slightly above price. [Neutral]
- CMF (20): 0.102, in accumulation territory and up from -0.117 on Oct 26. Money flow turned positive while price made lower lows, which suggests buyers absorbed the capitulation selling. [Accumulation]
- ADX (14): 36.6 with −DI 28.9 above +DI 19.2. ADX is a strong trend reading, but it has rolled over from 41.5 and the DI spread has narrowed sharply (+DI was 8.9 on Oct 26). The downtrend is still in control but losing force. [Strong Trend – Bearish, weakening]
- Volume: 79.83M, among the heaviest of the chart. Volume spiked on the Nov 11 bounce and the capitulation lows, which looks like a selling climax and heavy dip buying. The last two pullback days came on lower volume than the bounce. [Capitulation / Constructive]
DIVERGENCES & TRENDS
- Bullish divergence (CMF): Price made a lower low ($43.66 on Nov 5) versus the Oct 26 level ($55.19), while CMF rose from -0.117 to +0.102.
- Bullish divergence (RSI): RSI printed a roughly equal low (28.7 vs 27.4) while price fell about 20% lower.
- MACD: The bullish signal-line crossover occurred around Nov 11. The histogram is expanding positively, but both lines are far below zero.
- Long-term trend: A death cross is already in place, with SMA50D ($72.60) below SMA200D ($88.99). Price is far below SMA200D, so the primary trend is down.
- DI/ADX: −DI is still above +DI, but ADX is falling from its peak, which usually means trend exhaustion or a pause.
- VWAP: Price is well below VWAP ($78.34), so overhead supply is heavy.
- Recent action: The Nov 11 spike to $60.77 failed, and price has given back about $7.60 in two sessions. This is a warning that rallies are still being sold.
CHART PATTERNS
- Bullish Falling Wedge / descending channel (reversal): Price has fallen in a downward-sloping channel from the Oct highs, with the Nov 5 capitulation touching the lower band. A volume spike plus positive CMF and MACD fits an exhaustion bottom. A break above the upper trendline and EMA21 (~$58) would confirm it, with a first target near $62–64, the Oct 28 high.
- Bearish Pennant / Flag risk (continuation): The bounce to $60.77 followed by a fade could be a bear flag within the larger downtrend. A close below $48.40 would activate it, with a measured move toward $43 and lower.
- Takeaway: Neither pattern is confirmed, but the indicator divergences tilt toward the relief or reversal pattern.
POTENTIAL SCENARIOS
- Scenario 1: Bullish Relief Rally to EMA/Mid-Band Resistance — Capitulation volume, positive CMF and the MACD crossover support a base. Price holds the $48–49 area and grinds higher toward EMA21 and the Bollinger midline. Trigger: close above $57.63 (EMA21) on solid volume. Target: $58–62. Invalidation: close below $48.40. (45% probability)
- Scenario 2: Bearish Downtrend Continuation — The bounce fails at EMA21 as a bear flag, and the strong ADX/−DI trend resumes. Trigger: close below $48.40, then the $43.66 low. Target: $42–44, with a possible overshoot toward $40. Invalidation: close above $58 (EMA21). (38% probability)
- Scenario 3: Neutral Range Consolidation — Price chops between $46 and $58 as the downtrend exhausts and buyers and sellers balance. Trigger: ADX continues falling below 30 with no break of either boundary. Target: $50–56. Invalidation: a close outside $46–58. (17% probability)
PRICE TARGETS
The 34-day horizon calls for a range width of about 12–18%, with this range at roughly 18% ($9.50 / $53.13) even though ATR is high.
- Target Price: $55.80 (34 days)
- Expected Range: $49.50 to $59.00 (width $9.50, about 17.9% of current price)
- Key Levels: Support at $48.40, Resistance at $57.63
OVERALL BIAS
OVERALL BIAS: BULLISH - A capitulation-volume low with CMF accumulation, a MACD bullish crossover and falling ADX momentum favors a modest relief rally toward the EMA21 and Bollinger midline. Conviction is modest, because price is below all major moving averages, −DI still leads, and a failure at $57–58 would resume the downtrend.
This is educational analysis and not financial advice.