NBIS 34-day bearish forecast — Nov 15, 2026
- Bias: Bearish
- Timeframe: 34 days (made Nov 15, 2026, target date Dec 18, 2026)
- Price at analysis: $115.88
- Price target: $108.00
- Expected range: $98.00 – $119.00
- Result: Pending — graded after the close on Dec 18, 2026
Get a free AI analysis of NBIS today
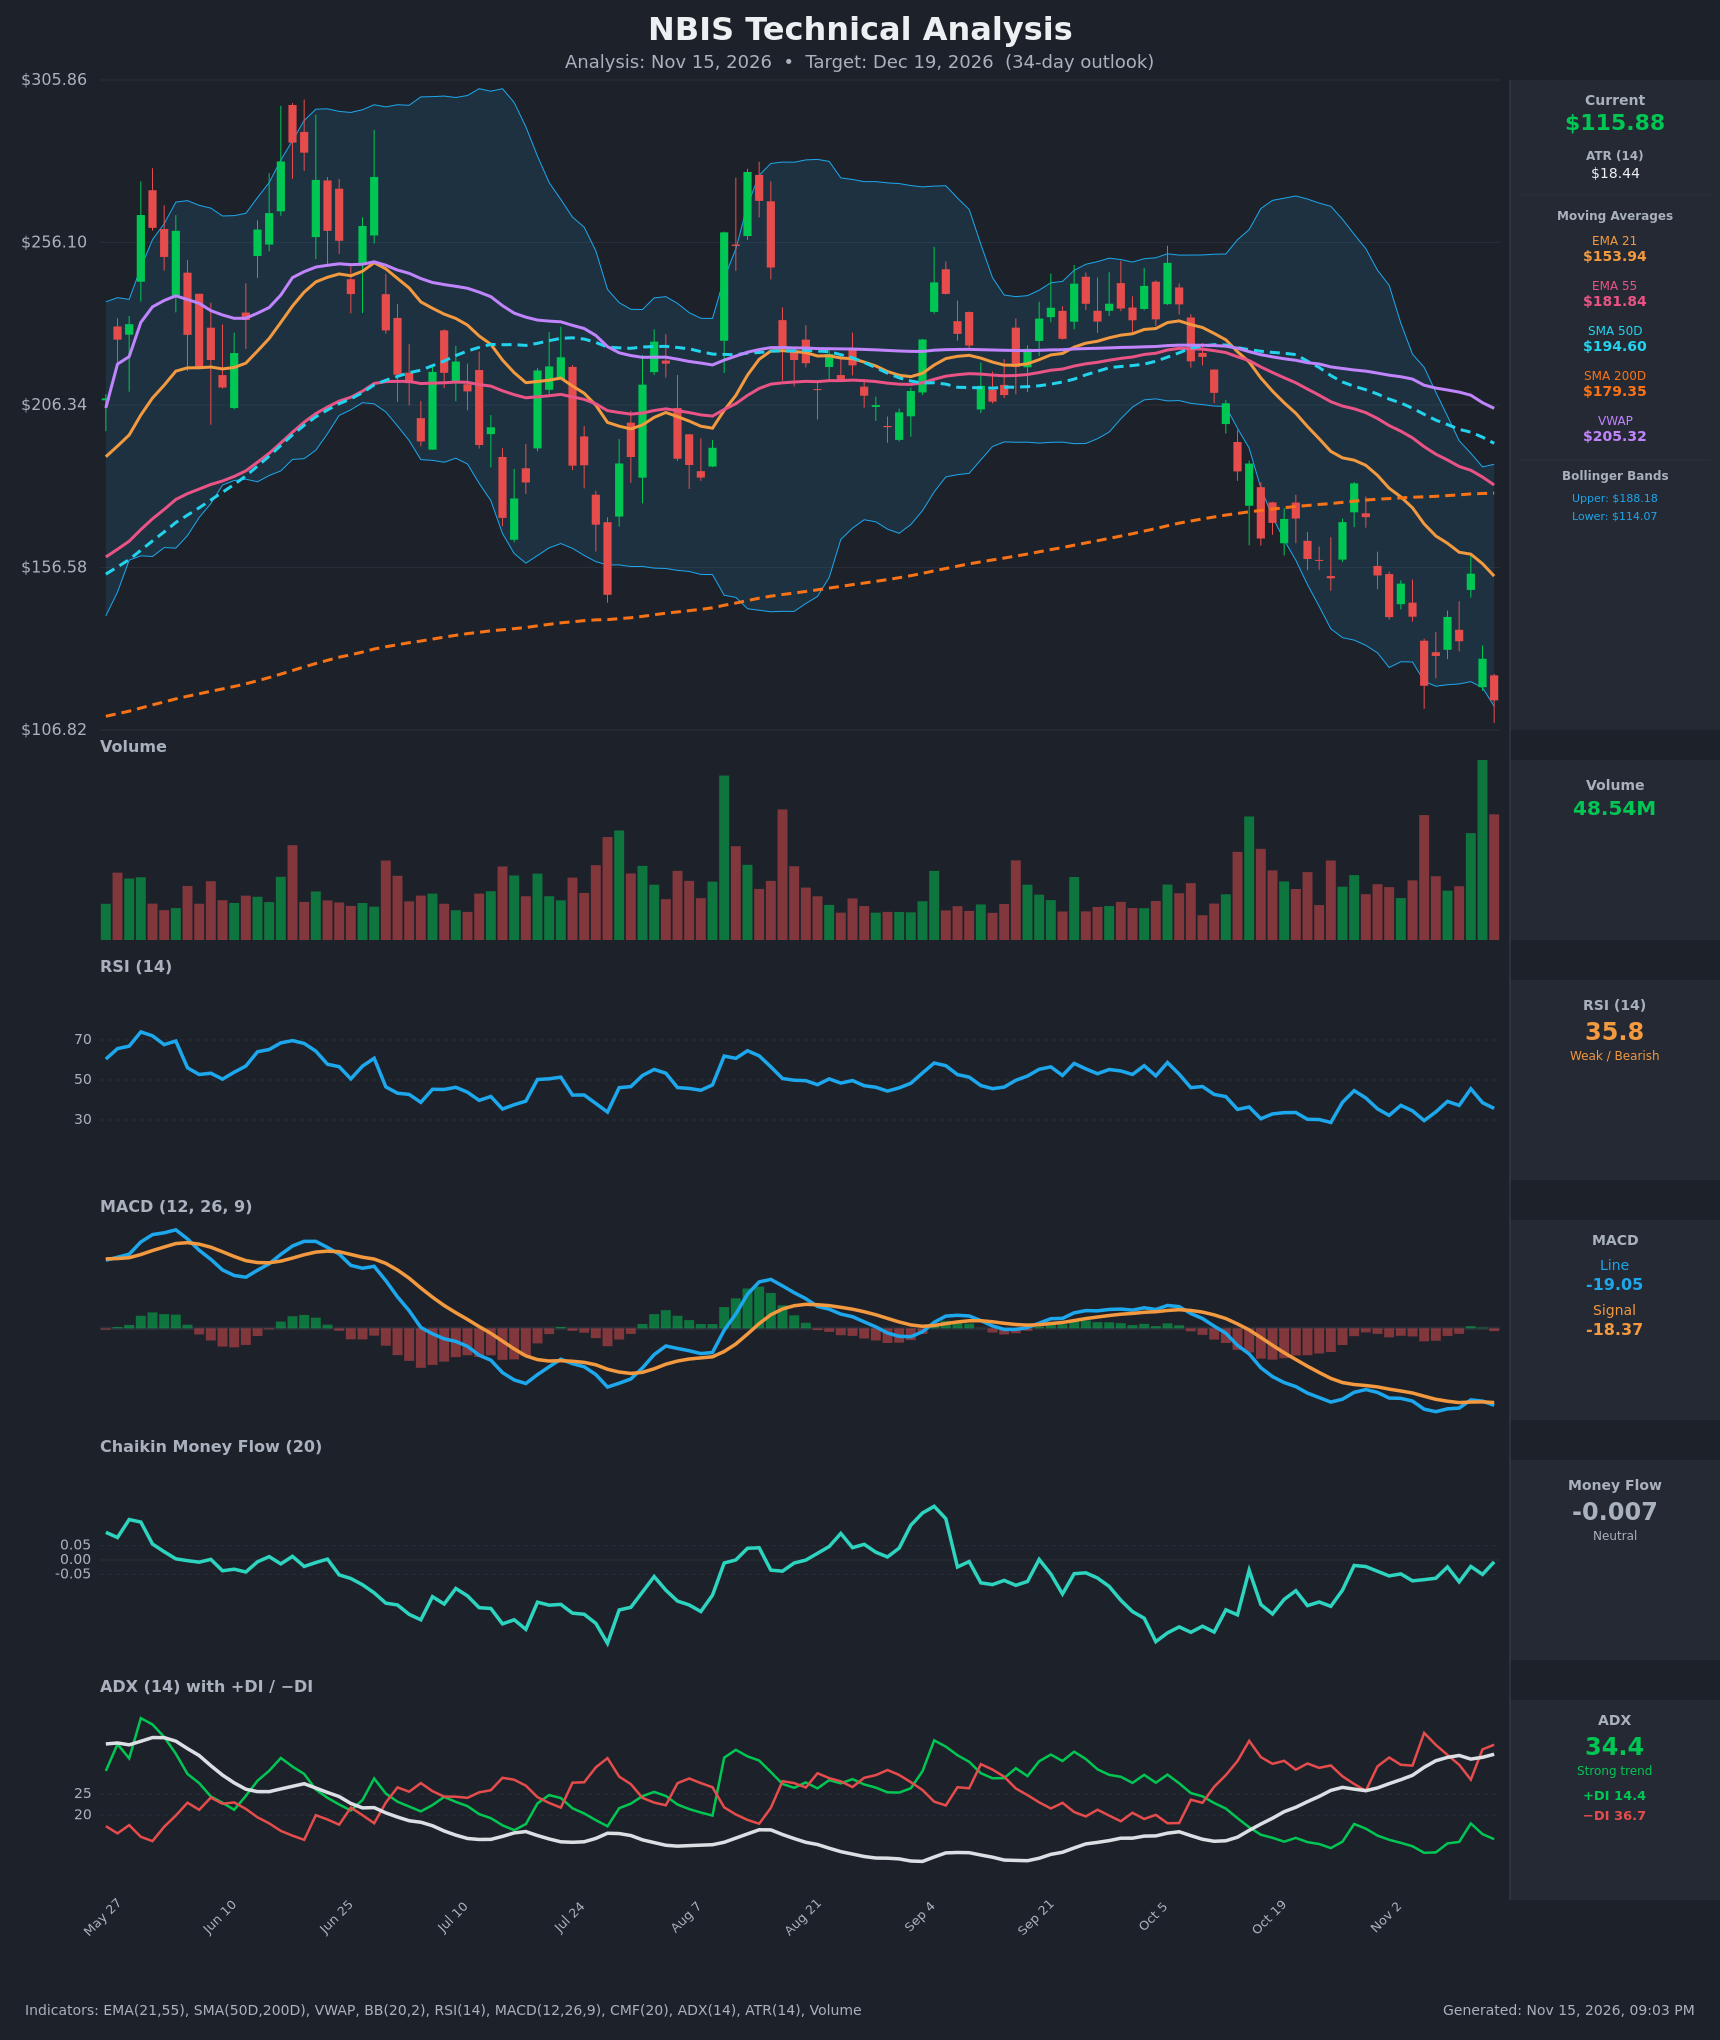
Analysis
TECHNICAL INDICATORS
- RSI (14): 35.79, down from 45.6 on Nov 11 and in a bearish regime of lower highs (45.6, 39.3, 37.3). It is near but not yet oversold (<30), so there is room for further downside. RSI touched ~29 on Oct 26 and Nov 5 and bounced each time. [Bearish]
- 20 EMA: The chart uses EMA 21 at $153.94. Price at $115.88 is about 25% below it, and the EMA is falling sharply (from $192 on Oct 26), so it acts as heavy overhead resistance. EMA21 is also below EMA55 ($181.84), a bearish alignment. [Bearish]
- MACD: Line -19.05 is below signal -18.37, so the histogram is slightly negative (~-0.68). The line crossed back below the signal on Nov 12 after a brief bullish cross on Nov 11. Both lines are deeply negative and making new lows, so momentum is still down, though the flat histogram shows downside momentum is not accelerating. [Bearish]
- Bollinger Bands (20): Price is $115.88 against a lower band of $114.07 (upper $188.18). It is hugging or walking the lower band after a sharp expansion, a sign of a strong downtrend. The bands are wide, so volatility is high. A stretch like this can lead to a snap-back toward the mid-band, but trending markets can keep riding the band. [Bearish]
- CMF (20): -0.007, in the neutral zone (±0.05). It has recovered from -0.16 on Oct 26 and shows no clear accumulation. Price is making new lows while CMF is flat to higher, a mild positive divergence, but it is not enough to call accumulation. [Neutral]
- ADX (14): 34.4 and rising, with −DI 36.7 far above +DI 14.4. This is a strong, established downtrend with sellers firmly in control, and the DI spread is widening again. [Strong Trend – Bearish]
- Volume: 48.54M, the highest bar on the chart, on a red candle at a new multi-month low. Heavy volume on breakdown days confirms the selling. It could also signal capitulation or exhaustion, but without a reversal candle it is not confirmed. [Bearish with possible capitulation]
DIVERGENCES & TRENDS
- Price vs. RSI: The Nov 5 low ($120.37) had RSI 29.7. The new low ($115.88) has RSI 35.8, a higher RSI low, which is a mild bullish divergence. It is unconfirmed, as RSI has not turned up.
- Price vs. CMF: Mild bullish divergence, since CMF has improved from -0.16 to roughly neutral while price made lower lows.
- Moving averages: Price is below the SMA200D ($179.35), VWAP ($205.32), and every EMA and SMA. SMA50D ($194.60) is falling toward SMA200D ($179.35), so a death cross looks likely within the next few weeks if the decline continues. EMA21 is already well below EMA55.
- Recent trend: Since the early-October peak (~$250) price has fallen about 55%, with consistent lower highs ($182, $154, $151, $141, $155) and lower lows ($141, $120, $116).
- ADX/DI: −DI has been above +DI since Oct 30, with no bullish DI cross.
- MACD: Re-crossed bearishly on Nov 12 and is making fresh lows.
CHART PATTERNS
- Dominant structure: A descending channel / bearish continuation with lower highs and lower lows. The bounces to $182 and $155 look like bearish flag/pennant relief rallies that failed, and a bearish rising wedge or descending triangle is a reasonable analogue for the failed bounces. The breakdown below the $120–$129 area resembles the diagram's continuation (bearish) outcome. The measured move from the Oct 28 flag points toward the low $100s.
- Possible bullish alternative: If price stabilizes and tightens, a Bullish Falling Wedge or Double Bottom (lows of $120.37 and about $115.88) could form. This needs a close above ~$141–$155 to confirm and is not yet present.
- Targets: Pattern-based downside is about $100–$108 (near the chart's $106.82 low and round-number support). Upside is capped by $129–$142 resistance.
POTENTIAL SCENARIOS
- Scenario 1: Bearish Trend Continuation — The strong downtrend (ADX 34, −DI dominant, price below all MAs) extends, with price walking the lower band and a possible death cross. Trigger: a daily close below $114 / $106.82 on solid volume. Target: $100–$108. Invalidation: a daily close above $129.50. (50% probability)
- Scenario 2: Bullish Oversold Relief Bounce — The capitulation-type volume, higher RSI low, and improving CMF fuel a mean-reversion rally toward the middle of the recent range. Trigger: a reversal candle and a close above $129.50 with MACD histogram turning positive. Target: $135–$145 (the EMA21 at ~$154 is the stretch target). Invalidation: a close below $106.82. (35% probability)
- Scenario 3: Neutral Basing Range — Price chops sideways as selling dries up. Trigger: RSI holding 30–45 with narrowing ranges. Target: $108–$125. Invalidation: a break outside $106 or $130. (15% probability)
PRICE TARGETS
- Target Price: $108.00 (34-day horizon)
- Expected Range: $98.00 to $119.00. Width $21.00, about 18.1% of current price, in line with the 30-60 day guidance.
- Key Levels: Support at $106.82, Resistance at $129.50
OVERALL BIAS
OVERALL BIAS: BEARISH - ADX of 34 with −DI (36.7) far above +DI (14.4), price below every moving average and the SMA200D, a bearish MACD re-cross, and heavy-volume breakdown candles favor continued downside. The bounce risk is real given the lower-band reading and the RSI/CMF divergence, so conviction is modest.
This is educational analysis and not financial advice.