AAL 13-day bearish forecast — Nov 15, 2026
- Bias: Bearish
- Timeframe: 13 days (made Nov 15, 2026, target date Nov 27, 2026)
- Price at analysis: $13.16
- Price target: $12.95
- Expected range: $12.45 – $13.60
- Result: Pending — graded after the close on Nov 27, 2026
Get a free AI analysis of AAL today
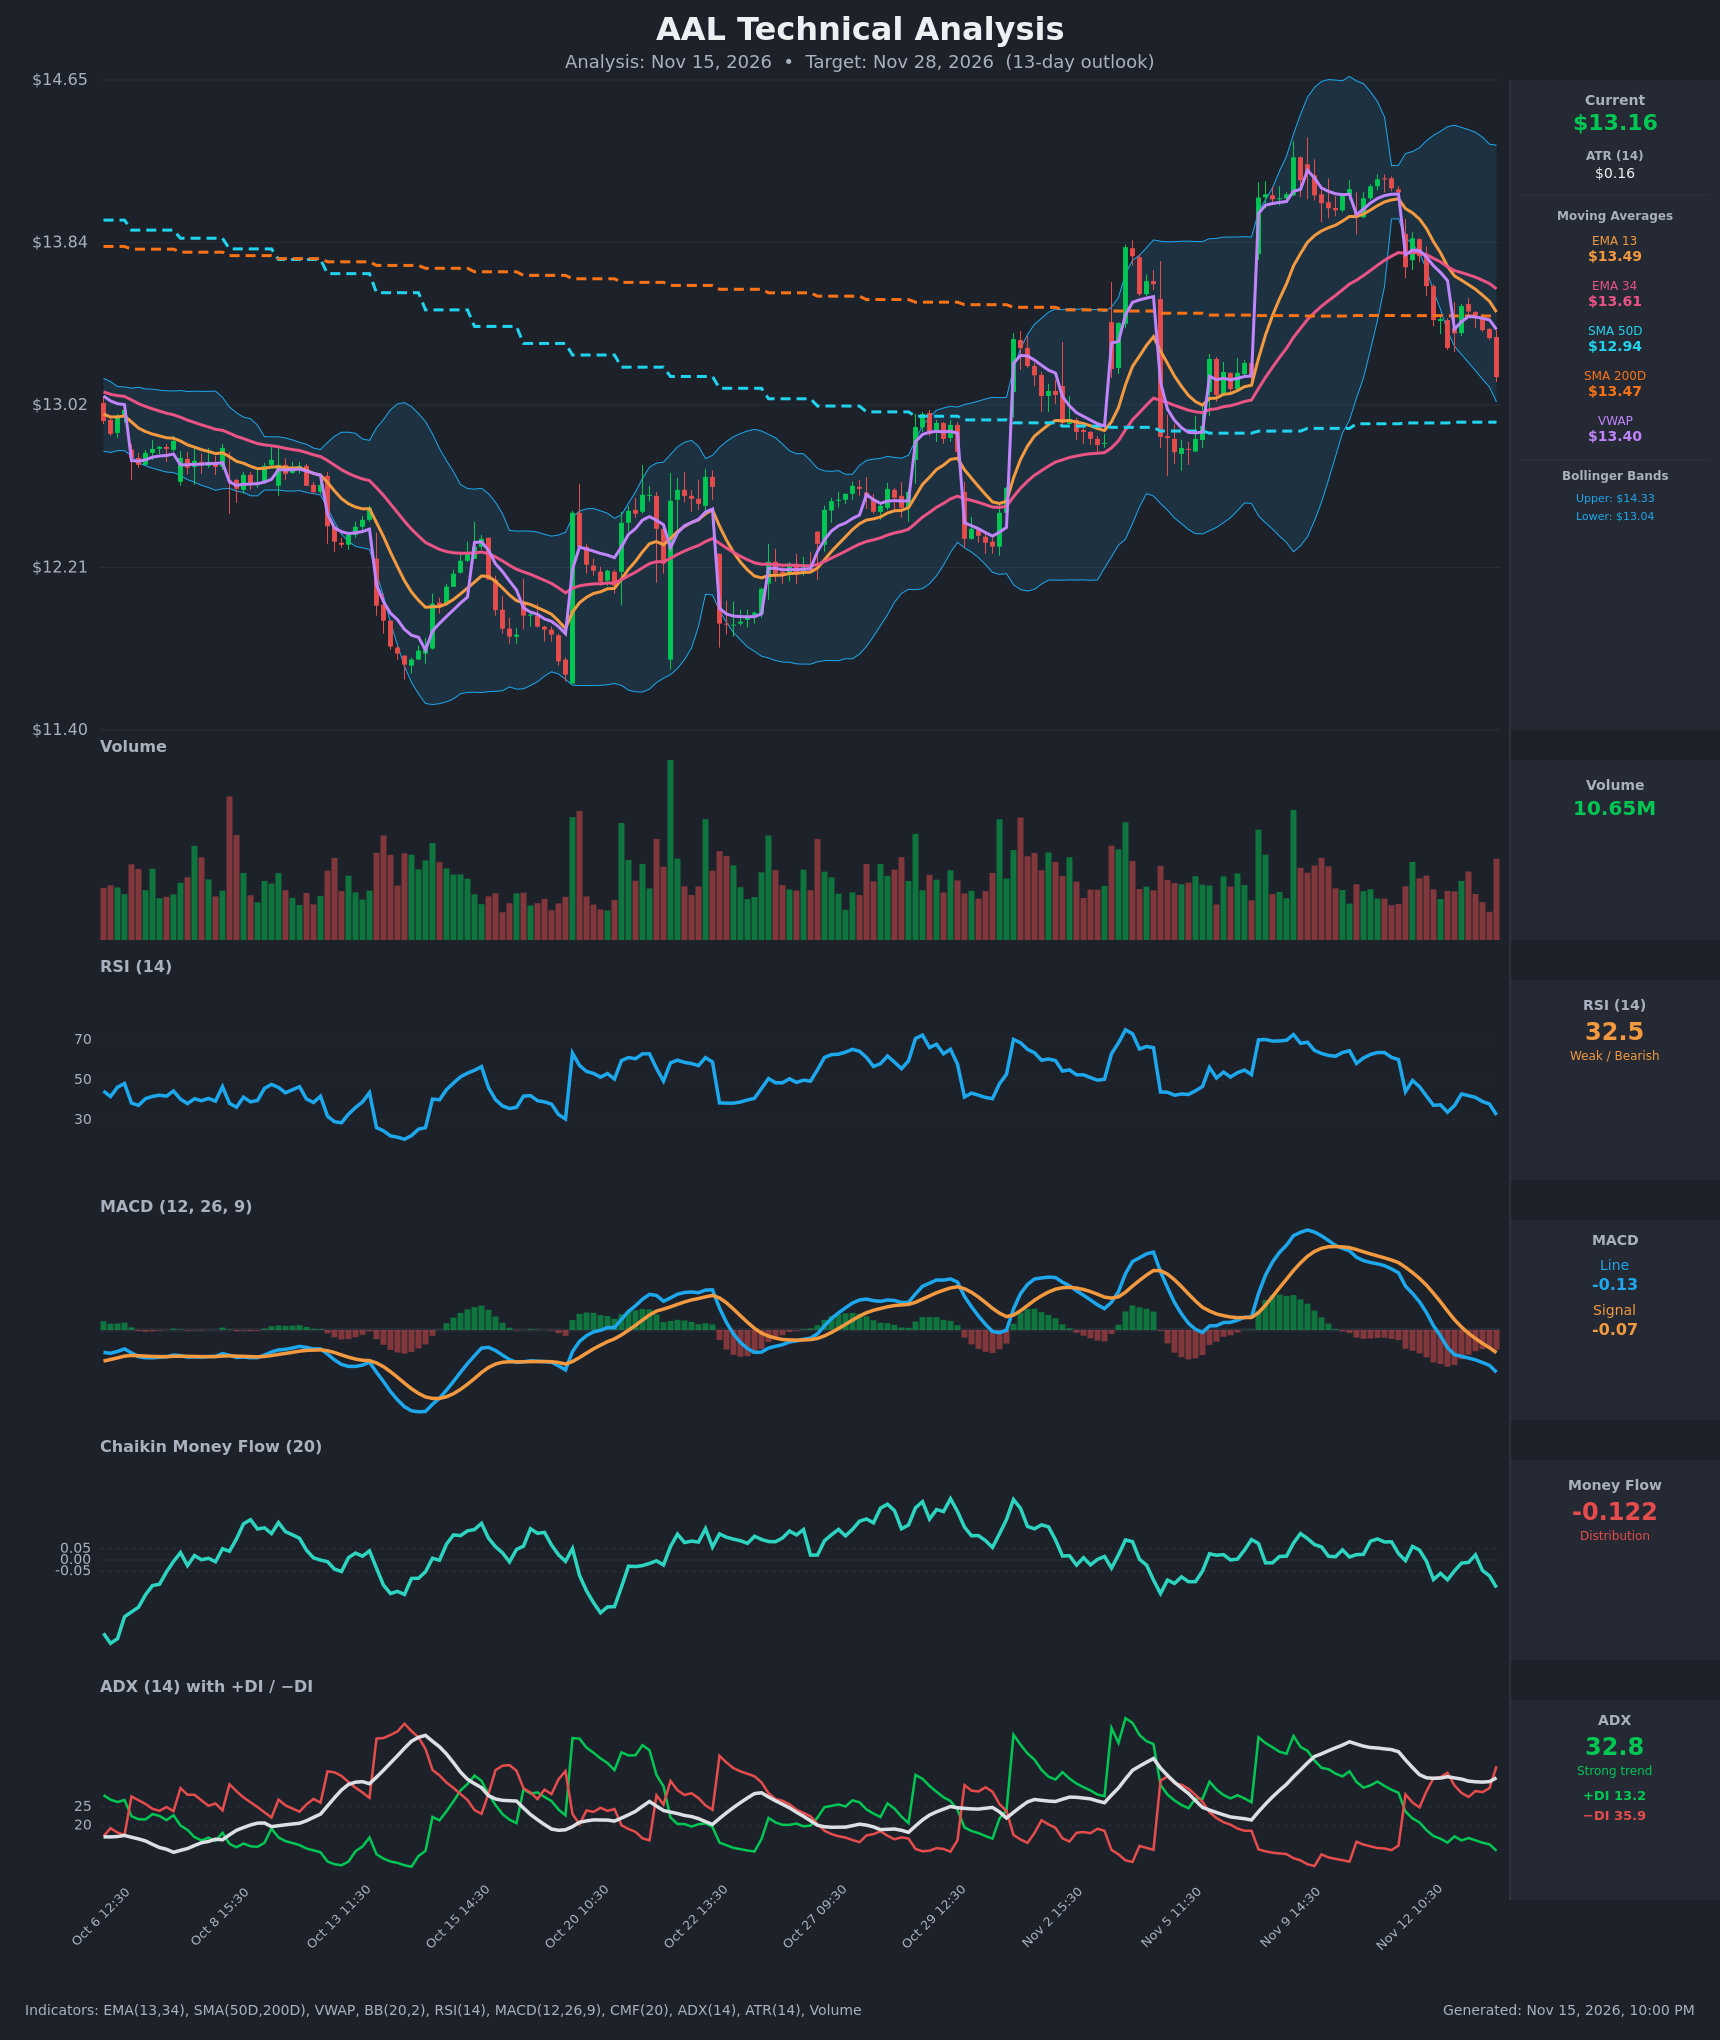
Analysis
TECHNICAL INDICATORS
- RSI (14): 32.53, just above the oversold line at 30. It has fallen from 60 on Nov 11 to the low 30s, so downside momentum is strong. It is not yet oversold, so there is room for further decline, but a bounce is plausible. [Bearish]
- 20 EMA (EMA 13/34 used): EMA 13 is $13.49 and EMA 34 is $13.61. Price at $13.165 is below both, and both are acting as overhead resistance. EMA 13 is below EMA 34 and the gap is widening. [Bearish]
- MACD: Line -0.1295, signal -0.0696. The bearish crossover happened around Nov 13 11:30 and the line is still pulling away below the signal. The histogram is negative and expanding. [Bearish]
- Bollinger Bands (20): Upper $14.326, lower $13.040. Price at $13.165 is near the lower band, about 10% of the band width. The bands are wide after the earlier rally, and the price is walking down toward the lower band. A break below $13.04 would signal continuation, while a touch of the band often brings a short-term bounce. [Bearish]
- CMF (20): -0.122, below the -0.05 threshold and falling from positive readings. This shows persistent distribution and selling pressure. [Distribution]
- ADX (14): 32.8 with +DI 13.2 and −DI 35.9. This is a strong trend, and −DI is far above +DI, so the bears are firmly in control. [Strong Trend – Bearish]
- Volume: 10.65M on the latest bar, with recent down bars carrying average-to-above-average volume. Selling is not exhausted and there is no capitulation spike yet. [Bearish – confirms the decline]
Other reference levels:
- Price is below VWAP ($13.40). [Bearish]
- Price is below SMA200D ($13.47), which is flat. [Bearish]
- Price is above SMA50D ($12.94), which is rising and sits about 1.7% below. [Support]
DIVERGENCES & TRENDS
- There is no bullish divergence yet. RSI, MACD and price are all making lower lows together.
- Momentum has deteriorated quickly. The MACD crossed down, the DI lines flipped to −DI dominance on Nov 12, and CMF turned negative.
- Price has lost the EMA 13, EMA 34, VWAP and SMA200 (~$13.47) in succession. This marks a failed breakout above the SMA200 and the Nov 9–11 high near $14.1–14.2.
- Price is heading toward the lower Bollinger Band and the rising SMA50D (~$12.94), which together form a confluence support zone.
- The 50D/200D relationship: SMA50 ($12.94) is below SMA200 ($13.47). That is a long-term bearish alignment, although the 50D is rising and the gap is narrowing.
CHART PATTERNS
- Bearish Head and Shoulders / Double Top (loosely): The rally to about $14.1–14.2 on Nov 9–11 was followed by a rollover. It resembles a lower-high structure that is rejecting from the upper band.
- Descending move after the rejection: Price is making lower highs and lower lows on the hourly chart. This is a bearish continuation or flag-like decline, not a confirmed reversal.
- Measured target: The prior swing from ~$12.9 to ~$14.1 is about $1.2 wide. A retracement of 50–61% lands near $13.5–13.4 from the top, which has already been exceeded. The next support is the SMA50D at ~$12.94, then the Oct 29 breakout area near $12.9–13.0.
POTENTIAL SCENARIOS
- Scenario 1: Bearish Continuation to SMA50 Support — −DI dominance, MACD and CMF all point to further selling. Price breaks the lower Bollinger Band and drifts toward the rising 50-day SMA and the prior breakout area. Trigger: hourly close below $13.04. Target: $12.80–$12.95. Invalidation: reclaim of $13.50 (EMA 13 / SMA200 zone). (55% probability)
- Scenario 2: Neutral Oversold Bounce and Range — RSI near 30 and the lower band produce a relief rally that stalls at the EMAs and VWAP. Price chops between $13.00 and $13.50. Trigger: hold of $13.04 with RSI turning up. Target: $13.35–$13.50. Invalidation: close below $12.95 or above $13.65. (30% probability)
- Scenario 3: Bullish Reversal — Buyers defend SMA50 and the lower band, and price reclaims the SMA200 and VWAP. Trigger: close above $13.65 with +DI crossing above −DI. Target: $14.00–$14.20. Invalidation: close below $13.00. (15% probability)
PRICE TARGETS
For the 13-day timeframe (Nov 28, 2026), the guidance is a 14–21 day style range of ~8–12% of price, so a range of about $1.15 (8.7%) is used.
- Target Price: $12.95
- Expected Range: $12.45 to $13.60 (width $1.15 ≈ 8.7% of current price)
- Key Levels: Support at $12.94, Resistance at $13.47
OVERALL BIAS
OVERALL BIAS: BEARISH - Price has broken below the EMAs, VWAP and SMA200. The MACD has crossed down, ADX is 32.8 with −DI (35.9) far above +DI (13.2), and CMF at -0.122 shows distribution. The likely destination is the rising SMA50D near $12.94, though a short-term bounce from the lower Bollinger Band is possible.
This is educational analysis and not financial advice.