F 13-day bearish forecast — Nov 15, 2026
- Bias: Bearish
- Timeframe: 13 days (made Nov 15, 2026, target date Nov 27, 2026)
- Price at analysis: $11.91
- Price target: $11.78
- Expected range: $11.25 – $12.30
- Result: Pending — graded after the close on Nov 27, 2026
Get a free AI analysis of F today
Analysis
TECHNICAL INDICATORS
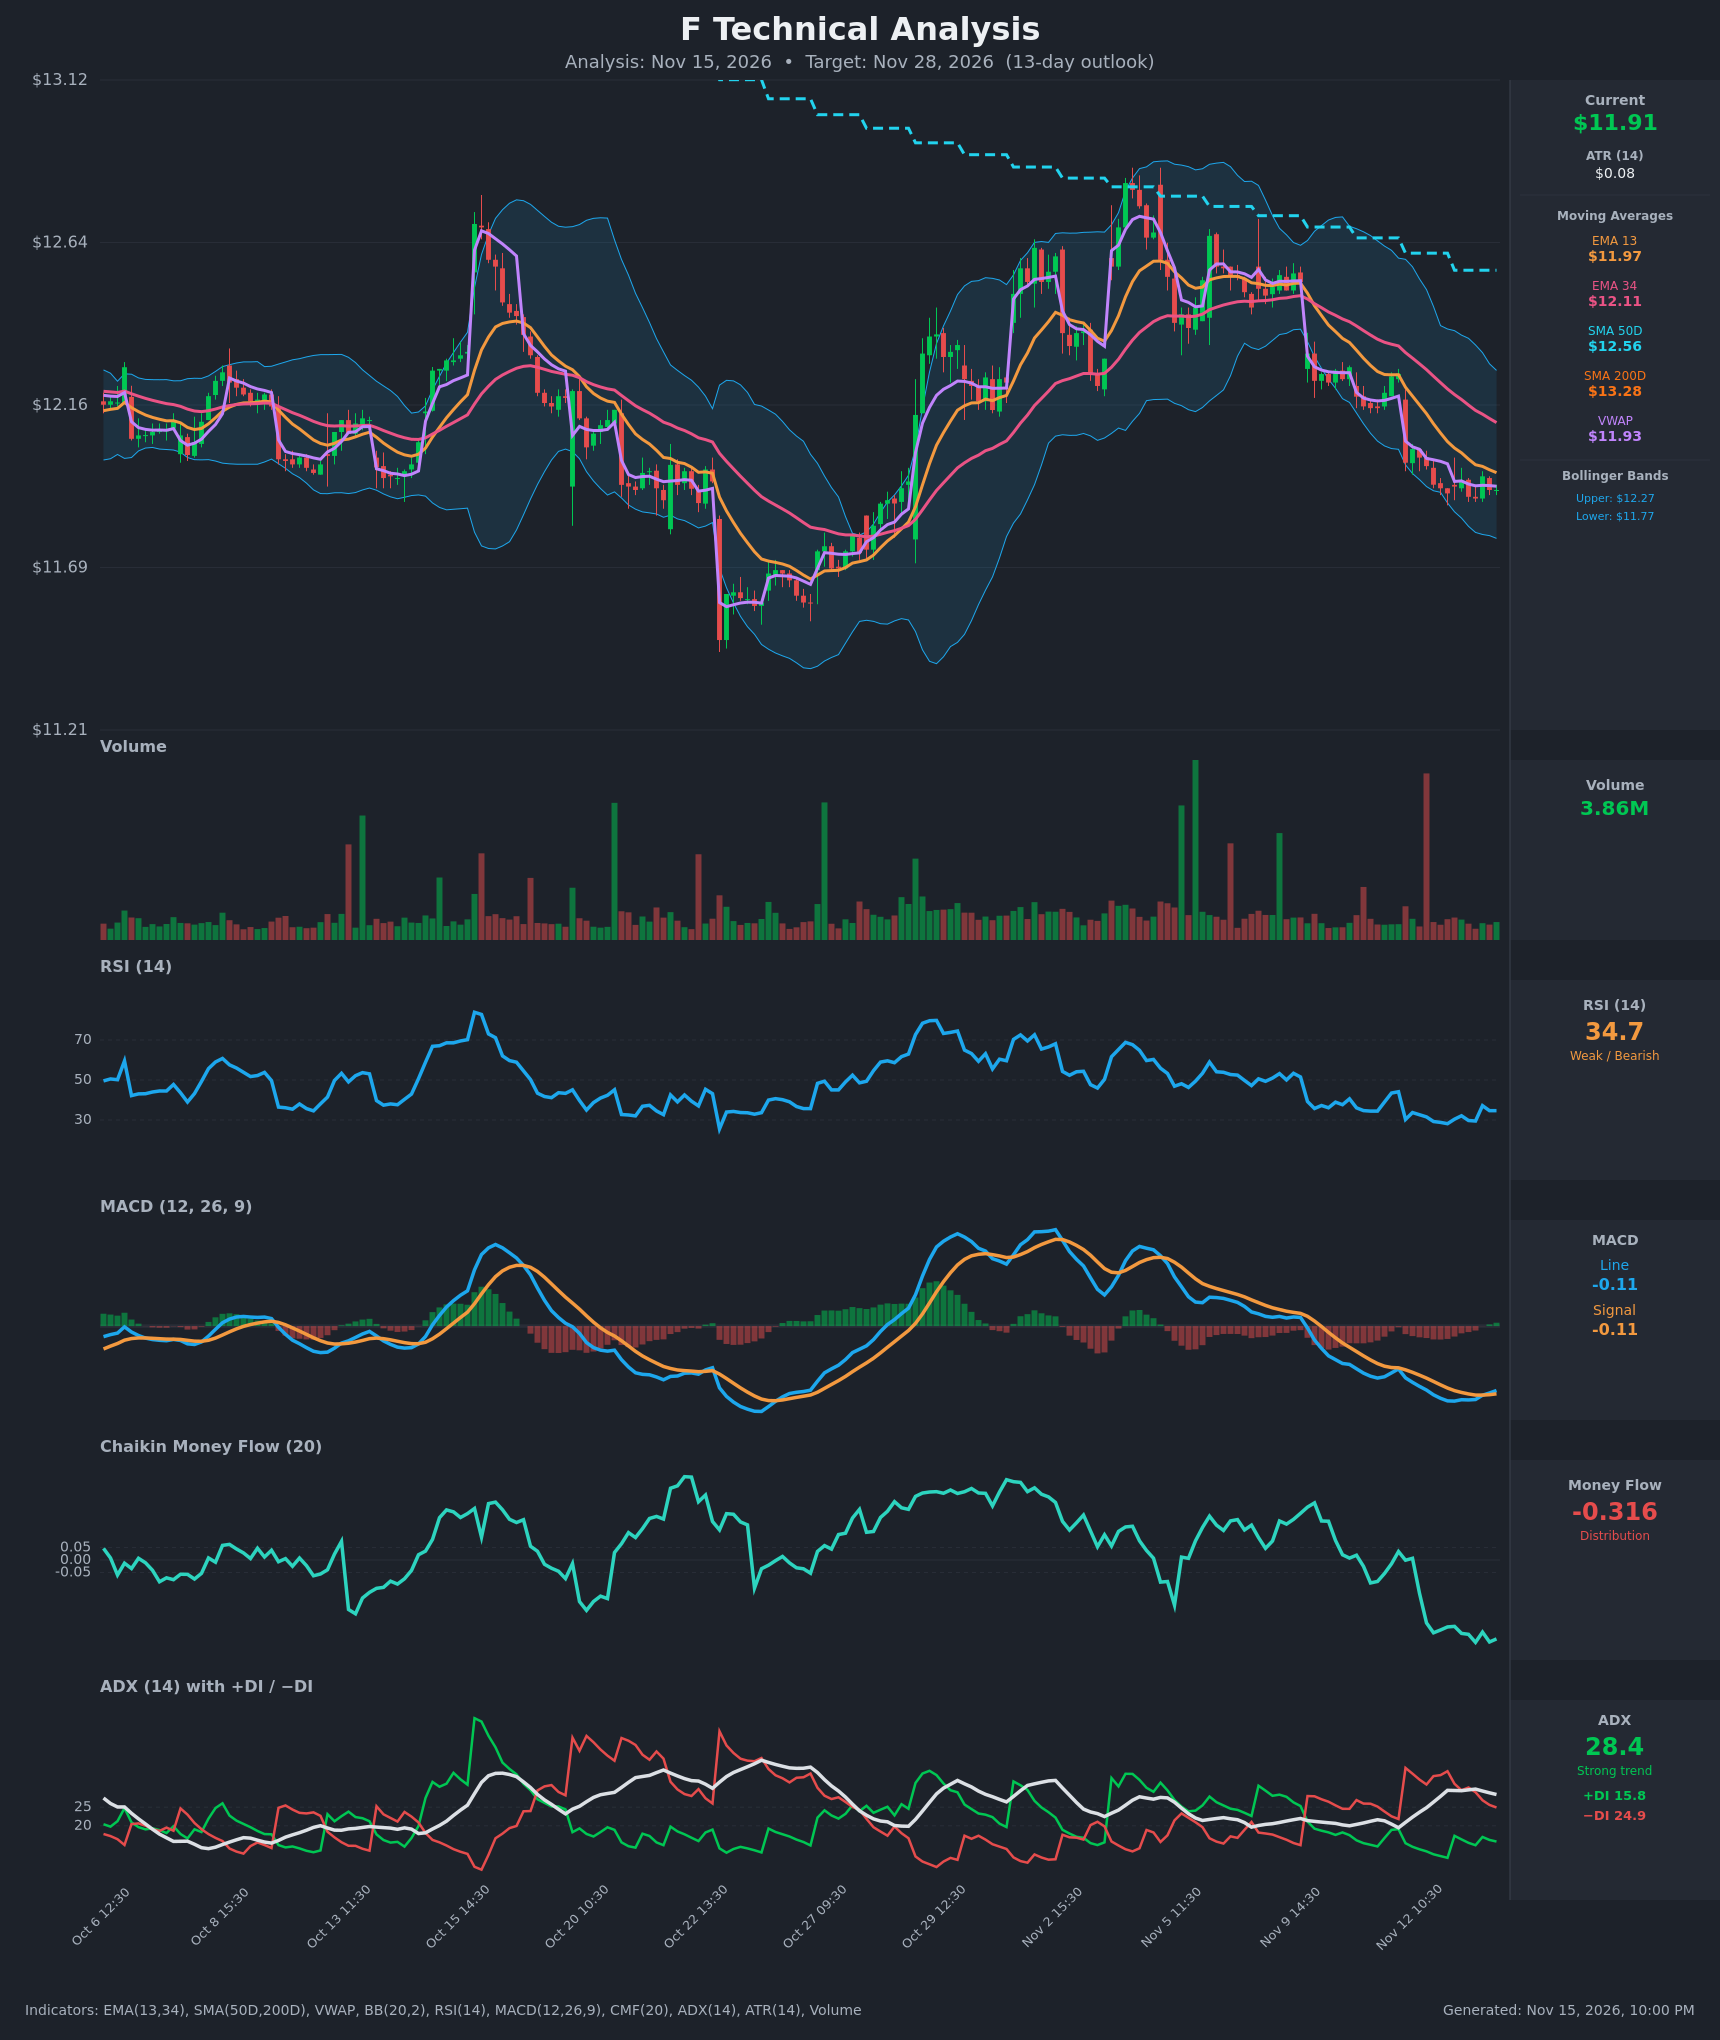
- RSI (14): 34.66, close to oversold but not there yet. It has spent most of the last two sessions between 28 and 37 and is making lower lows on the larger swing. Momentum is weak with no sign of a bullish turn. [Bearish]
- EMA 13 / EMA 34: EMA13 is $11.97 and EMA34 is $12.11, with price at $11.915 below both. EMA13 is below EMA34, so the bearish alignment is intact, and both slope down and act as overhead resistance. [Bearish]
- MACD: Line -0.1073 against signal -0.1129. The line has just crossed above the signal (it was -0.115 vs -0.115 at Nov 13 13:30, then moved above). The histogram is barely positive, and both lines are below zero. This is a minor momentum stabilization, not a trend reversal. [Neutral]
- Bollinger Bands (20): Upper $12.27, lower $11.77, with price at $11.915 in the lower third. The bands are narrowing after the decline, and price has been riding the lower half. The midline is around $12.02, which is resistance. [Bearish]
- CMF (20): -0.316, deep distribution and the weakest reading on the chart. It has fallen from positive in early November with no sign of recovery, so sellers are dominating volume. [Distribution]
- ADX (14): 28.4 with -DI 24.9 above +DI 15.8. The trend is strong and bearish. ADX has plateaued near 29-30 and -DI has been narrowing toward +DI, which hints at some loss of downside momentum. [Strong Trend – Bearish]
- Volume: 3.86M, roughly average to below average over the recent sessions. There is no capitulation spike, so selling is steady rather than climactic, and no volume-backed reversal has appeared. [Neutral-to-Bearish]
Other moving averages and VWAP:
- SMA50D is $12.56 and SMA200D is $13.28, and price is below both. SMA50D is below SMA200D, so the longer-term trend is bearish (death-cross structure already in place).
- VWAP is $11.926, essentially at price. Price is just under VWAP, which is neutral to slightly bearish.
DIVERGENCES & TRENDS
- There is no clear bullish RSI divergence. RSI is near 29-35 versus 28-30 earlier, and price is making marginally lower lows, so momentum is mildly stabilizing but not diverging.
- The MACD line has just crossed above its signal at deeply negative levels. This is an early, low-quality bounce signal that is not confirmed by CMF or RSI.
- CMF is trending sharply down from +0.2 to -0.3, which is a strong bearish money-flow trend.
- ADX is above 25 with -DI dominant, but the DI spread has narrowed (from 23 points to 9). The downtrend is intact but decelerating.
- Moving averages are fully stacked bearish: price < EMA13 < EMA34 < SMA50 < SMA200.
- The mid-November drop from about $12.30 fell through the lower channel, and price has since consolidated tightly around $11.90-$11.96.
CHART PATTERNS
- Bearish Flag/Pennant (continuation): After the sharp drop from about $12.3 to $11.9, price is drifting sideways in a tight range, which resembles a bearish flag/pennant. A breakdown below ~$11.85 would target roughly $11.50-$11.60 (flag-pole measure).
- Possible base (minor): Price is holding $11.89-$11.96, the same area as the late-October low region at $11.5-$11.7 only further below, so there is no confirmed double bottom.
- Overall, the dominant structure is a downtrend with consolidation, so continuation lower is favored over reversal. A move back above $12.10 (EMA34) would weaken the bearish read.
POTENTIAL SCENARIOS
- Scenario 1: Bearish Continuation Lower — Price breaks below the $11.89 consolidation low, with ADX above 25, -DI dominant and CMF deeply negative, and drifts toward the late-October low zone. Trigger: close below $11.85 on rising volume. Target: $11.55-$11.65. Invalidation: close above $12.11 (EMA34). (50% probability)
- Scenario 2: Neutral Range Consolidation — Price chops between $11.78 (lower band) and $12.05 as MACD flattens and the oversold RSI limits further downside. Trigger: failure to break either $11.85 or $12.02. Target: $11.85-$12.00. Invalidation: decisive close outside $11.75-$12.15. (28% probability)
- Scenario 3: Bullish Relief Bounce — The MACD crossover and near-oversold RSI spark a mean-reversion bounce to the EMAs and the middle band. Trigger: reclaim of $12.02-$12.05 with a CMF uptick. Target: $12.15-$12.25. Invalidation: drop below $11.80. (22% probability)
PRICE TARGETS
For 13 days (the 7-21 day range implies ~8-12% width):
- Target Price: $11.78
- Expected Range: $11.25 to $12.30 (width $1.05, about 8.8% of the current price)
- Key Levels: Support at $11.70, Resistance at $12.11
OVERALL BIAS
OVERALL BIAS: BEARISH - Price is below every moving average with a death-cross structure, ADX is above 25 with -DI dominant, and CMF at -0.316 shows heavy distribution. The minor MACD crossover and near-oversold RSI argue for a possible bounce, but the weight of evidence favors drift lower toward $11.70-$11.80.
This is educational analysis and not financial advice.