AAPL 13-day bullish forecast — Nov 15, 2026
- Bias: Bullish
- Timeframe: 13 days (made Nov 15, 2026, target date Nov 27, 2026)
- Price at analysis: $356.40
- Price target: $361.50
- Expected range: $343.00 – $371.00
- Result: Pending — graded after the close on Nov 27, 2026
Get a free AI analysis of AAPL today
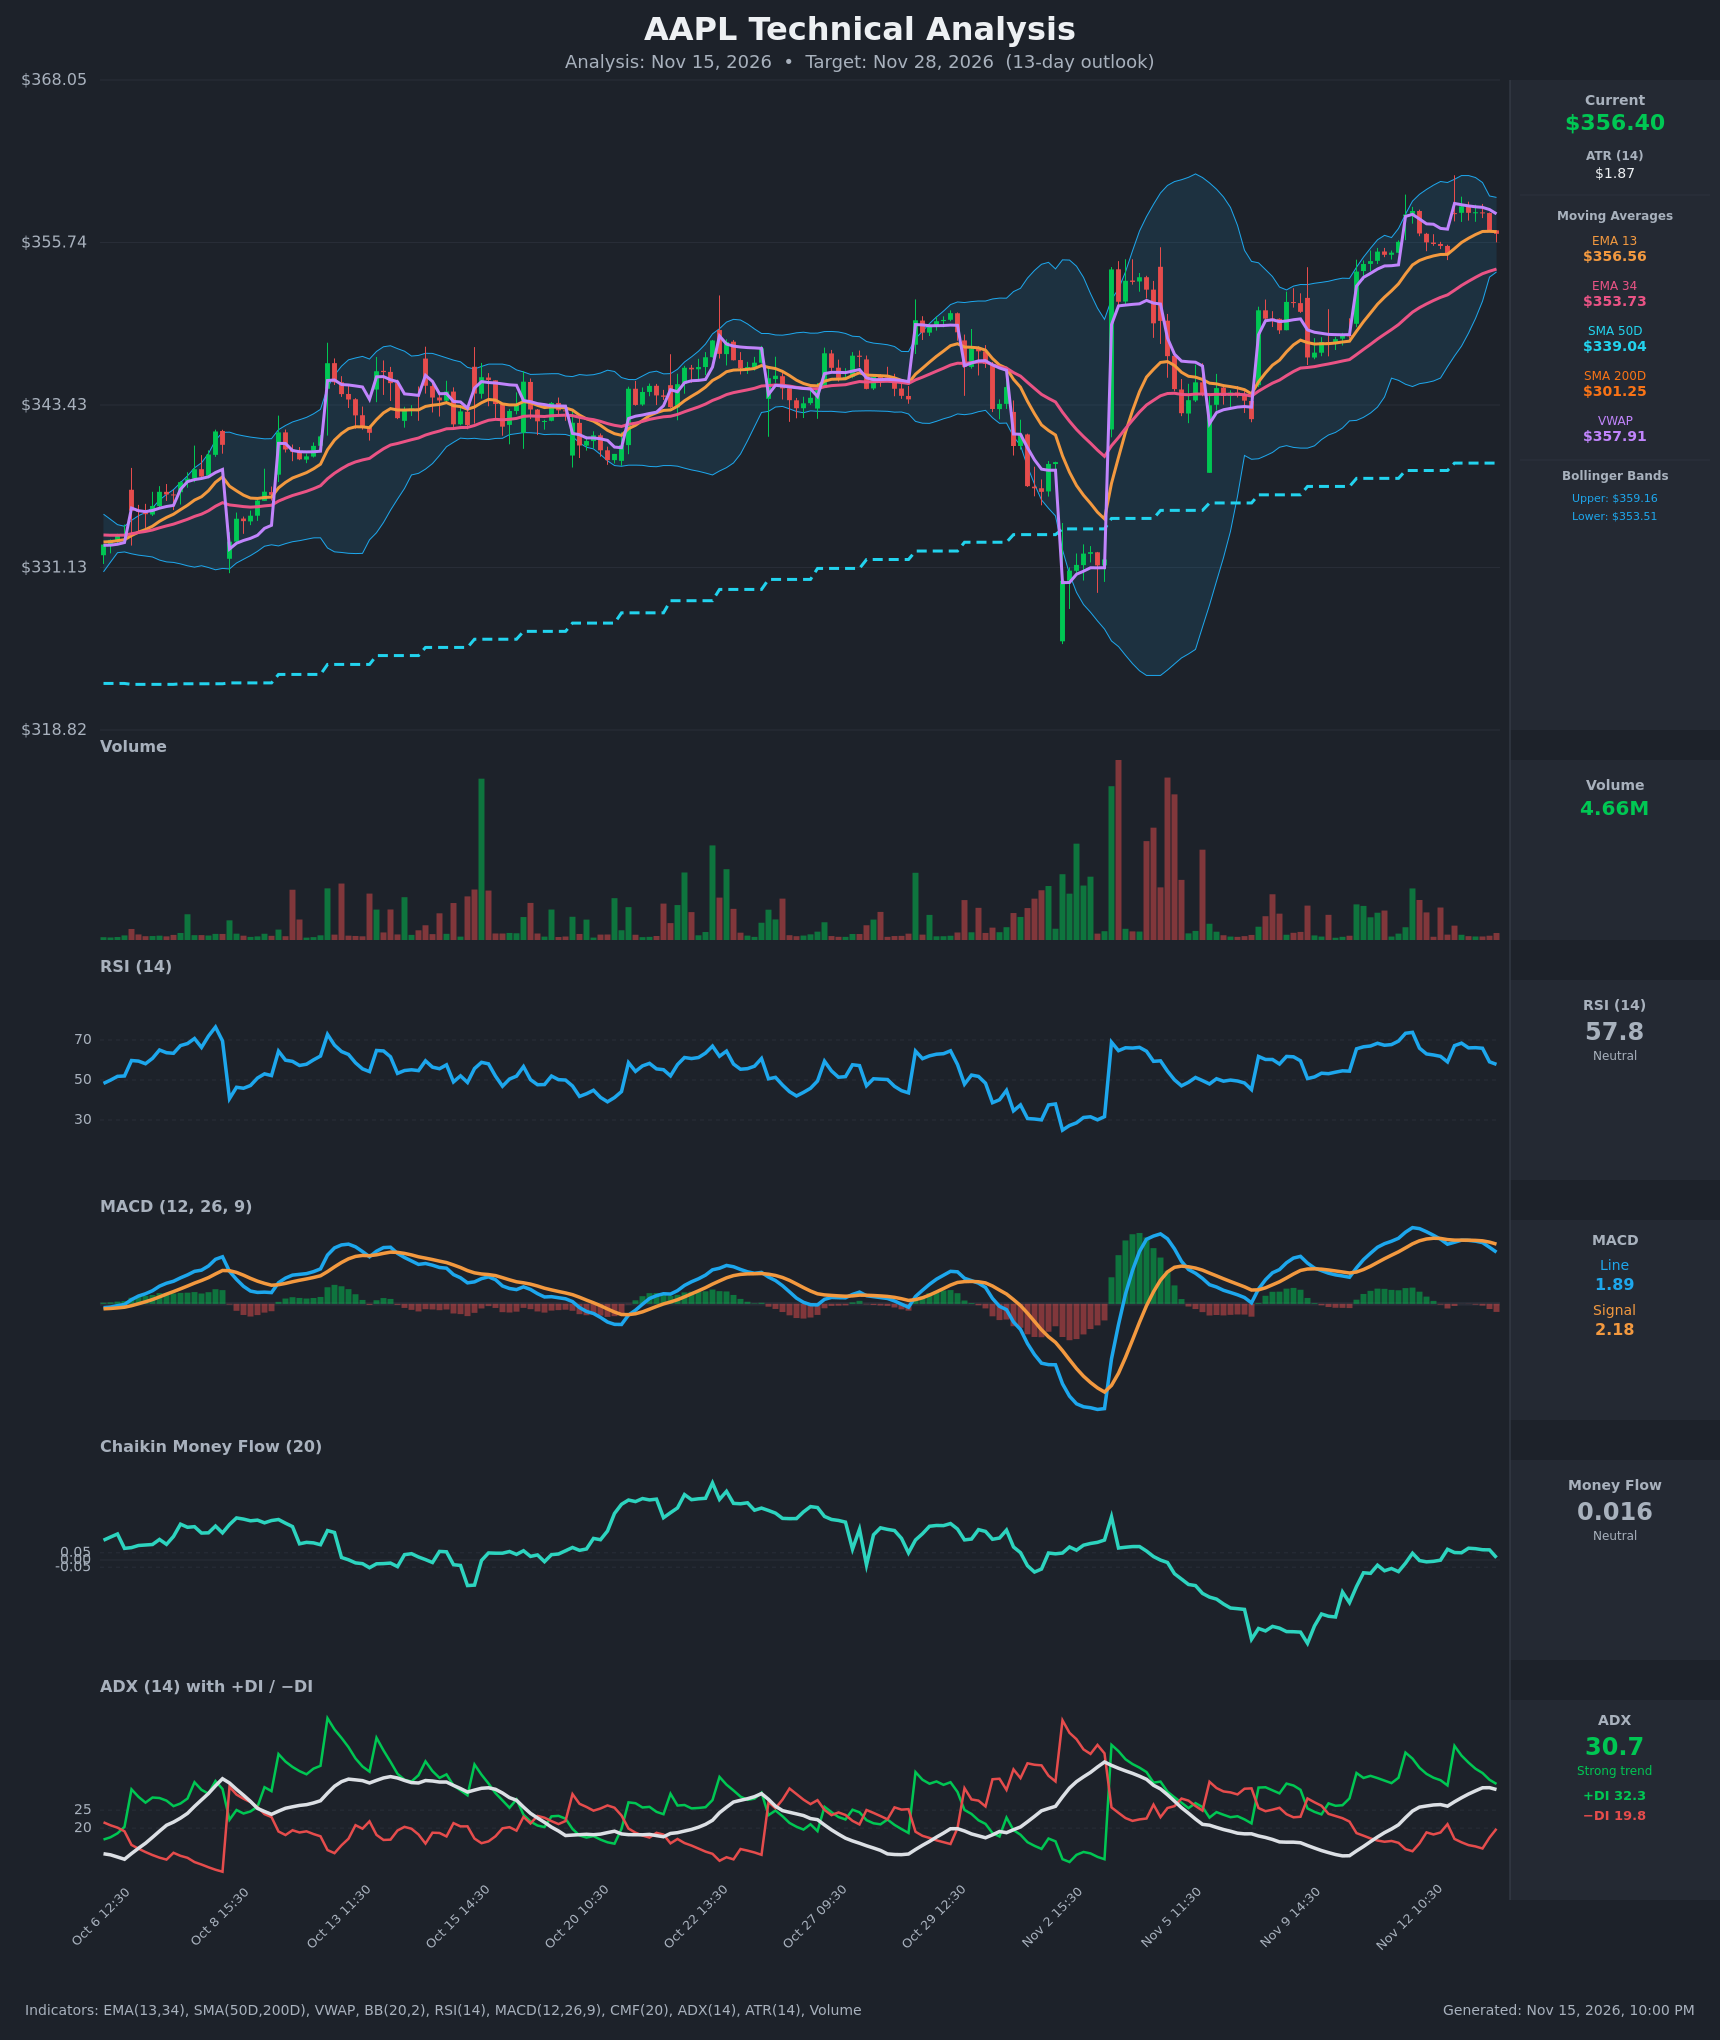
Analysis
TECHNICAL INDICATORS
- RSI (14): 57.8, down from about 68 earlier in the session and from 73 on Nov 12. It has cooled from overbought toward neutral, so momentum is fading in the short term while still above 50. [Neutral]
- 20 EMA: The data gives EMA 13 at $356.56 and EMA 34 at $353.73. Price ($356.40) sits right on the EMA 13, which is acting as a pivot. EMA 13 is above EMA 34 and both are rising, so the trend structure is intact. Price is also well above SMA50D ($339.04) and SMA200D ($301.25), a long-term uptrend with the 50D above the 200D. [Bullish]
- MACD: Line 1.889 is below Signal 2.183, with a negative histogram of about -0.29. The bearish cross happened on Nov 12 at 14:30. The line has rolled over from about 2.8, so short-term momentum is bearish. The line is still well above zero. [Bearish]
- Bollinger Bands (20): Upper $359.16, lower $353.51, middle about $356.3. Price is at the midline after being rejected near the upper band. The bands are narrow compared with the early-November expansion, which points to a volatility squeeze and a possible expansion move. [Neutral]
- CMF (20): 0.016, inside the neutral zone (±0.05). It has faded from 0.08 to 0.016, so buying pressure is weakening but there is no distribution yet. The rebound from the deeply negative readings in early November is intact. [Neutral]
- ADX (14): 30.7 with +DI 32.3 above −DI 19.8. ADX has been rising from about 21 to above 30, and the trend is strong with bulls in control. −DI has ticked up from about 14 to 20, which shows some pullback pressure. [Strong Trend – Bullish]
- Volume: 4.66M, light and below the spikes of early November. The recent pullback and consolidation are on declining volume, so there is no heavy selling or distribution. The advance also lacks strong participation. [Neutral / Mildly Constructive]
DIVERGENCES & TRENDS
- Mild bearish momentum divergence (short-term): Price is holding near its highs ($358.48 peak vs $358.13 earlier), while RSI (73.8 to 68.4 to 57.8) and MACD (2.79 to 2.33 to 1.89) are making lower highs. This points to a pause or minor pullback rather than a reversal.
- Moving averages: EMA 13 is above EMA 34, and price is above the SMA50D and SMA200D, so the trend is bullish. There is no death cross, and the 50D is well above the 200D.
- MACD: The bearish line/signal cross on Nov 12 is the main caution.
- ADX/DI: +DI is dominant and ADX is above 30, so the uptrend is strong. −DI is edging up.
- VWAP: Price ($356.40) is below VWAP ($357.91), a mild intraday-weakness signal.
- CMF: It is fading toward zero from slightly positive, so buying pressure is flattening.
CHART PATTERNS
- Bullish Flag / Pennant (continuation): After the sharp rebound from the early-November low (about $330) to $358, price has spent the last few sessions in a tight range of roughly $354.9–$358.5 on shrinking volume. This resembles the Bullish Flag/Pennant in the reference diagram. A break above $358.50–$359.20 would project a measured move toward $362–$368.
- Ascending staircase of higher lows: Price has made higher highs and higher lows since about Nov 5. The risk is a Bearish Rising Wedge if momentum keeps fading while price grinds higher. That would be confirmed by a break below the EMA 34 (about $353.7) and the lower Bollinger Band ($353.5), which would aim at $345.
- Resistance / swing high: The chart shows a spike high near $362. A move above it would complete the continuation.
POTENTIAL SCENARIOS
- Scenario 1: Bullish Flag Breakout and Trend Continuation — The dominant uptrend (ADX above 30, +DI well above −DI, price above all key MAs) resolves the tight consolidation upward as the MACD histogram turns back up. Trigger: a close above $359.16 (upper Bollinger Band) and then $362 on rising volume. Target: $361.50 base case, with an extension to $366–$368. Invalidation: a daily close below $353.50. (50% probability)
- Scenario 2: Bearish Pullback to the EMA 34 / 50-Day Zone — The MACD bearish cross, fading RSI, weakening CMF and price below VWAP lead to a deeper retracement. Trigger: a break below $353.50 (EMA 34 / lower band). Target: $345–$348, with a deeper test of $343. Invalidation: a reclaim of $358.50 on volume. (28% probability)
- Scenario 3: Neutral Range Consolidation — Price chops between $353.5 and $359 as the bands stay tight and momentum resets. Trigger: continued low volume and RSI holding near 50–60. Target: $355–$358. Invalidation: a decisive close outside the $353.5–$359.2 range. (22% probability)
PRICE TARGETS
- Target Price: $361.50 (13-day horizon, Nov 28, 2026)
- Expected Range: $343.00 to $371.00. Width is $28, about 7.9% of the current price, which fits the 7–21 day guidance. It is about 2x or more the width of a 2–3 day range.
- Key Levels: Support at $353.50 (lower Bollinger Band / EMA 34 zone), Resistance at $359.16 (upper Bollinger Band, with the swing high near $362 above it)
OVERALL BIAS
OVERALL BIAS: BULLISH - The trend is strong (ADX 30.7, +DI above −DI, price above the EMA 13/34, SMA50D and SMA200D) and price is consolidating in a flag-like pattern on light volume. The MACD bearish cross and fading RSI argue for patience and a possible dip toward $353.5, but the evidence favors an upside resolution toward about $361.50.
This is educational analysis and not financial advice.