AMD 13-day bearish forecast — Nov 15, 2026
- Bias: Bearish
- Timeframe: 13 days (made Nov 15, 2026, target date Nov 27, 2026)
- Price at analysis: $534.09
- Price target: $524.00
- Expected range: $499.00 – $549.00
- Result: Pending — graded after the close on Nov 27, 2026
Get a free AI analysis of AMD today
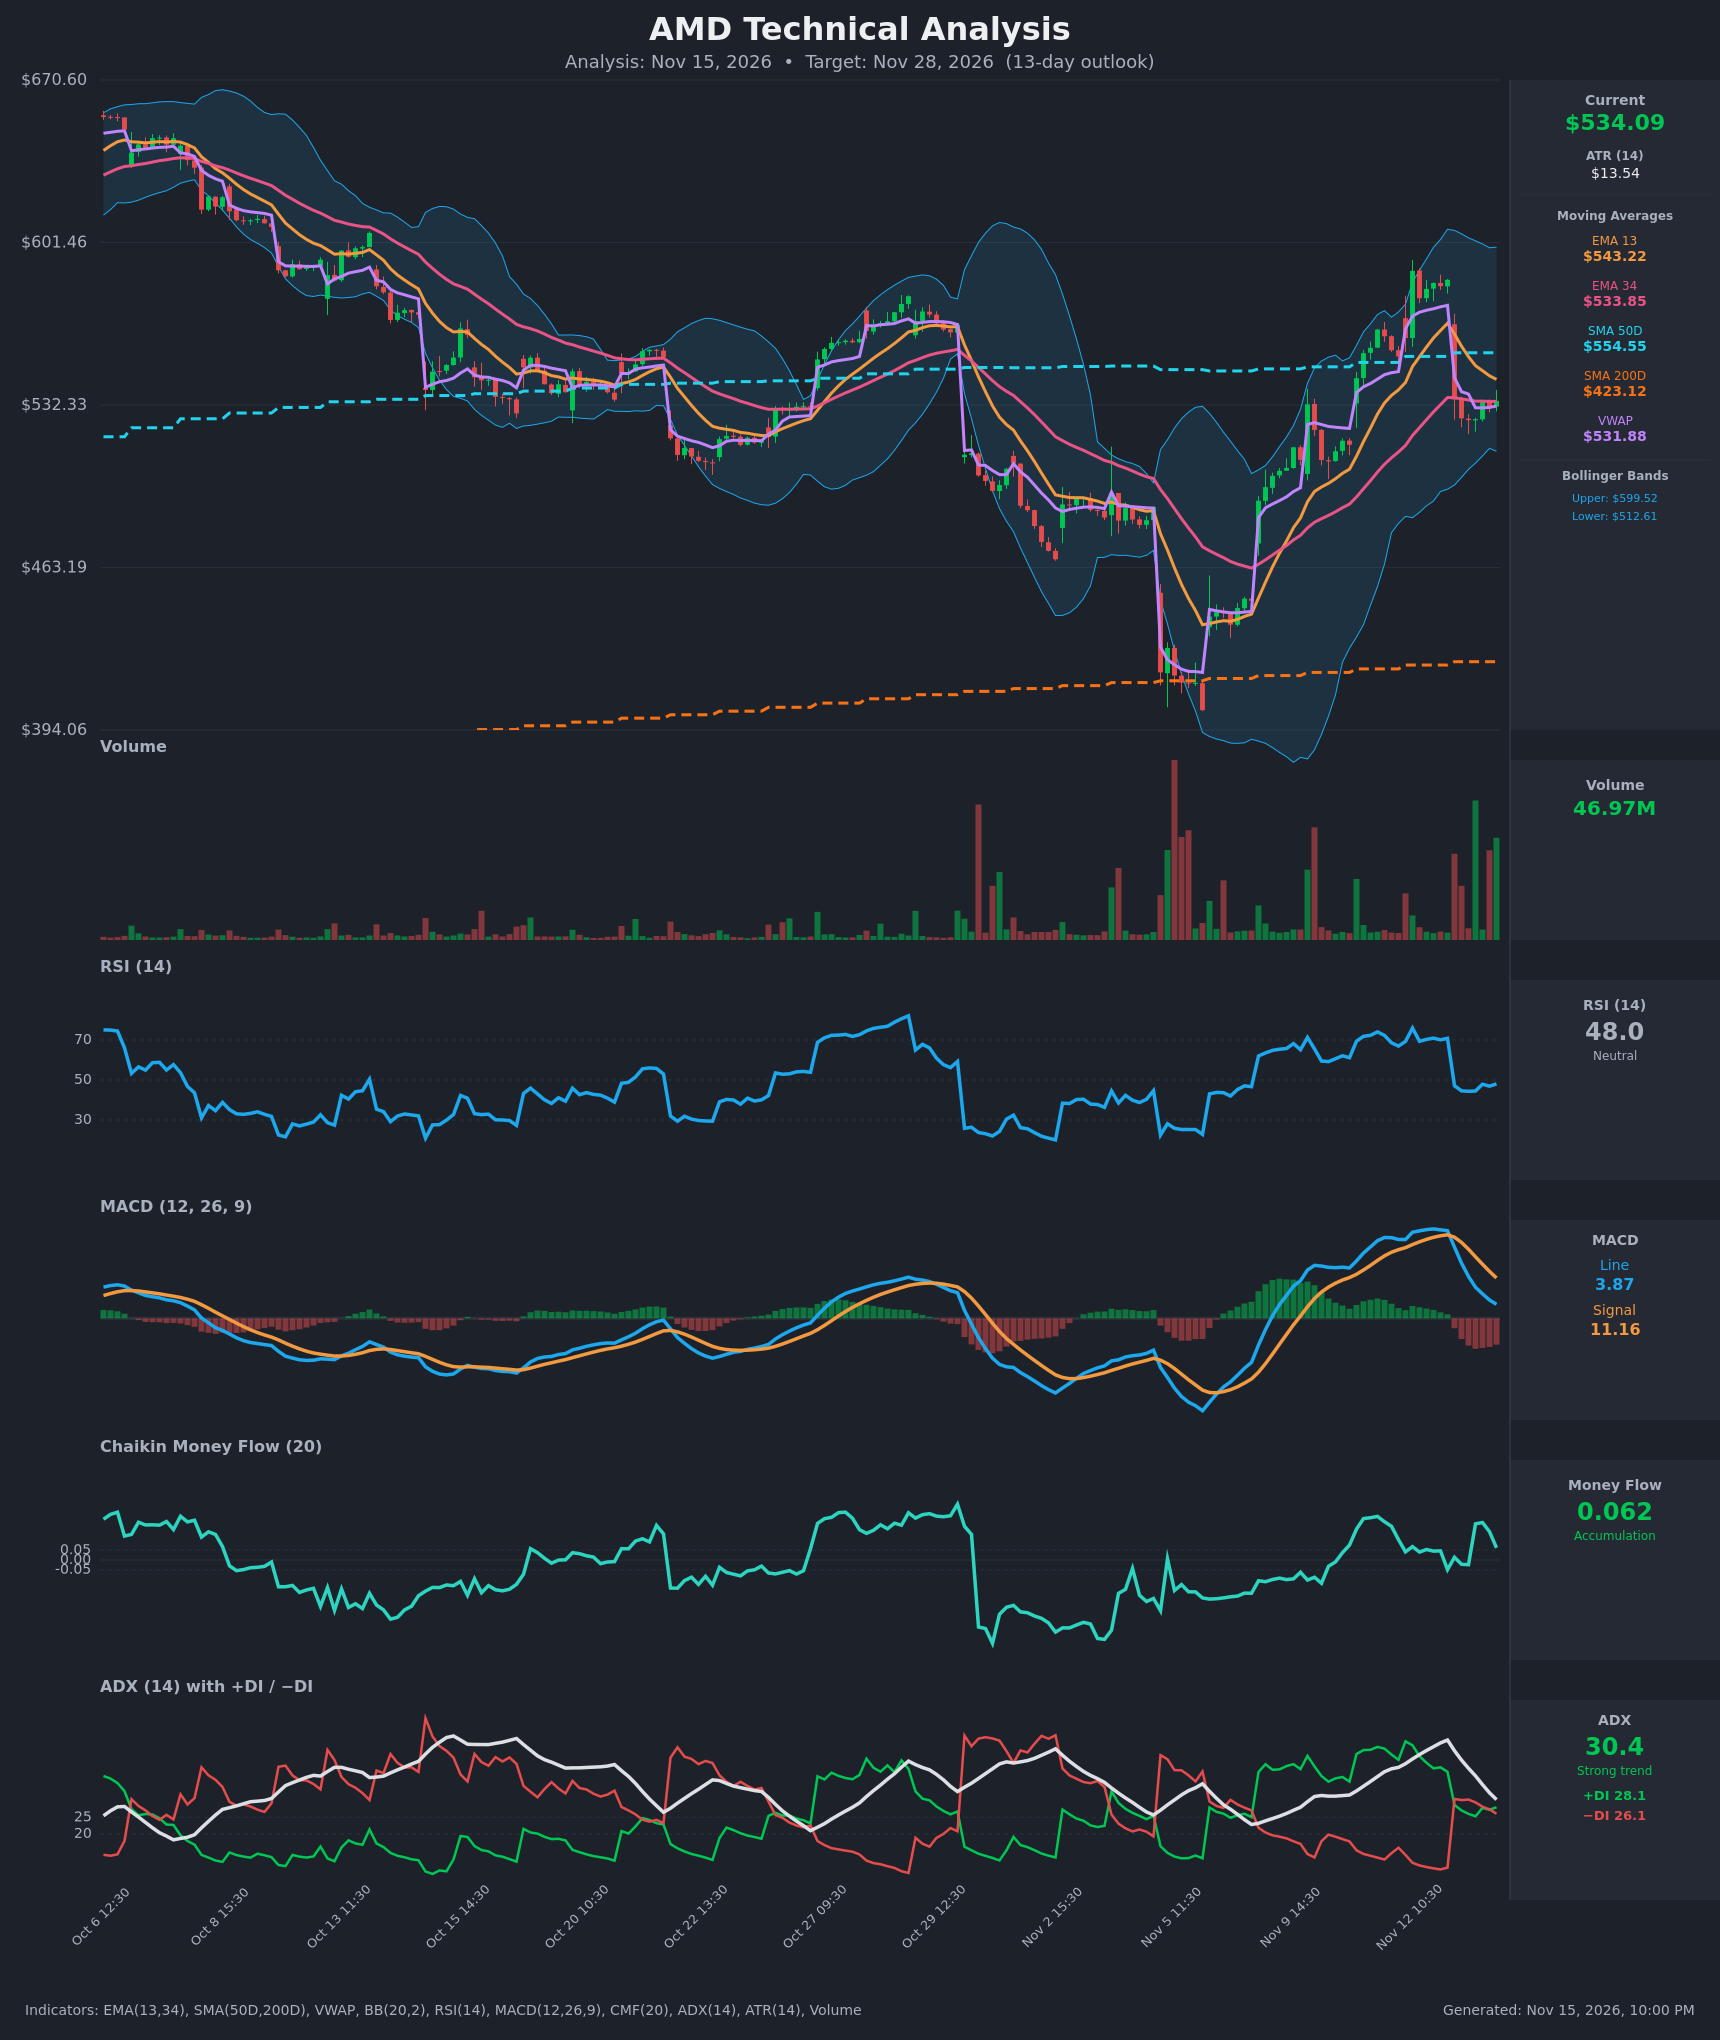
Analysis
TECHNICAL INDICATORS
- RSI (14): 48.05, neutral after collapsing from ~71 (overbought) to the mid-40s on the Nov 13 gap down. It has since stabilised at 44-48 with no bullish momentum yet. [Neutral]
- 20 EMA: The data gives EMA 13 at $543.22 and EMA 34 at $533.85. Price ($534.09) sits right on the EMA 34 and below the EMA 13, which has turned down and is converging on the EMA 34. EMA 13 is still marginally above EMA 34, but a bearish cross is close. The EMA 13 is overhead resistance and the EMA 34 is the last line of support. [Bearish]
- MACD: The line (3.87) is below the signal (11.16) after a bearish crossover on Nov 13. The histogram is deeply negative (about -7.3) but the decline is slowing. Momentum is clearly down, with the line approaching the zero line. [Bearish]
- Bollinger Bands (20): Upper $599.52, lower $512.61, midline around $556. Price is in the lower half of the bands, about 25% of the way up from the lower band. It is below the midline, which acts as resistance. The bands are wide after the recent volatility. [Bearish]
- CMF (20): 0.062, just above the +0.05 threshold. It has faded from 0.19 and been in and out of the neutral zone over the last bars, so the accumulation signal is marginal and weakening. [Neutral]
- ADX (14): 30.4 and falling from 48, so the prior uptrend is losing strength. +DI 28.1 versus −DI 26.1 is nearly converged after −DI spiked above +DI on the gap down. Bulls hold only a very slim edge, and a DI crossover is possible. [Strong but Weakening Trend, Direction Unclear]
- Volume: 46.97M, elevated versus the recent baseline. Heavy volume came on the gap down and on the preceding rally bars. Selling volume has been absorbed near $525, but buyers have not yet shown decisive follow-through. [Neutral to Mildly Bearish]
Other moving averages and VWAP:
- Price is below the SMA50D ($554.55), which is resistance.
- Price is far above the SMA200D ($423.12), so the long-term structure is intact.
- Price is marginally above VWAP ($531.88), a small near-term positive.
DIVERGENCES & TRENDS
- There is no clear RSI or MACD divergence. The recent peak at ~$585 came with RSI ~70 and MACD ~24, so momentum confirmed the high before it reversed.
- The MACD bearish crossover and the RSI drop from 70 to 48 show a sharp momentum reversal.
- ADX is rolling over from 48 to 30 while +DI and −DI converge, so trend strength is fading. This points to consolidation or a trend change rather than a continuation of the rally.
- The prior rally from ~$440 to ~$585 produced a lower high than the early-October levels, so the broader structure since early October is still a series of lower highs.
- The SMA50D is flat to rising and the SMA200D is rising, with no cross imminent.
- Price has been rejected at the SMA50D and sits at the EMA 34 pivot. A close below it would shift the tone further bearish.
CHART PATTERNS
- Bearish Head and Shoulders / Double Top (loose): The ~$585 peak followed by the gap down resembles a failed breakout. Price has not yet broken a clear neckline, so this is only a possibility.
- Bearish Pennant / Flag (possible): The tight consolidation at $525-$535 after the sharp drop could be a pause before further downside. A break below ~$525 and the lower Bollinger Band at $512.6 would project toward ~$495-$500.
- Gap-fill dynamic: The gap from $585 down to $534 may attract a retracement, but the SMA50D at $554.55 and the EMA 13 at $543 stack up as resistance.
- No high-confidence textbook pattern completes, so the evidence leans on momentum and moving-average structure.
POTENTIAL SCENARIOS
- Scenario 1: Bearish Breakdown Below the EMA 34 and Range Lows — Bearish MACD, price below the EMA 13 and SMA50D, and converging DIs suggest sellers retain control. Price loses the $525 support area and tests the lower Bollinger Band. Trigger: a close below $525 and then below $512.6 on rising volume. Target: $495-$512. Invalidation: a daily close above $556 (SMA50D and Bollinger midline). (45% probability)
- Scenario 2: Neutral Range Chop — Price stays between the $512 lower band and the SMA50D around $555 as ADX fades. Trigger: holding $520-$530 and failing at the $543-$555 resistance cluster. Target: $520-$550. Invalidation: a close beyond either $512 or $556. (30% probability)
- Scenario 3: Bullish Recovery and Gap Fill — CMF accumulation and the EMA 34/VWAP support spark a bounce. Trigger: a close above the EMA 13 ($543) and then the SMA50D ($554.55) with +DI crossing clearly above −DI. Target: $570-$585. Invalidation: a close below $520. (25% probability)
PRICE TARGETS
For the 13-day timeframe, ranges should be ~4-12% wide, so I am using about 9.4%.
- Target Price: $524.00 (13 days; Nov 28, 2026)
- Expected Range: $499.00 to $549.00 (width $50 ≈ 9.4% of current price)
- Key Levels: Support at $512.61 (lower Bollinger Band; secondary $499), Resistance at $554.55 (SMA50D; nearer resistance at $543.22, EMA 13)
OVERALL BIAS
OVERALL BIAS: BEARISH - The MACD bearish crossover with a negative histogram, price below the EMA 13, SMA50D and Bollinger midline, and the sequence of lower highs since early October outweigh the marginal CMF and VWAP support. The target is a drift toward the $512 lower band, though the long-term uptrend above the SMA200D and fading ADX keep conviction modest.
This is educational analysis and not financial advice.