HOOD 13-day bearish forecast — Nov 15, 2026
- Bias: Bearish
- Timeframe: 13 days (made Nov 15, 2026, target date Nov 27, 2026)
- Price at analysis: $77.87
- Price target: $74.80
- Expected range: $70.50 – $79.50
- Result: Pending — graded after the close on Nov 27, 2026
Get a free AI analysis of HOOD today
Analysis
TECHNICAL INDICATORS
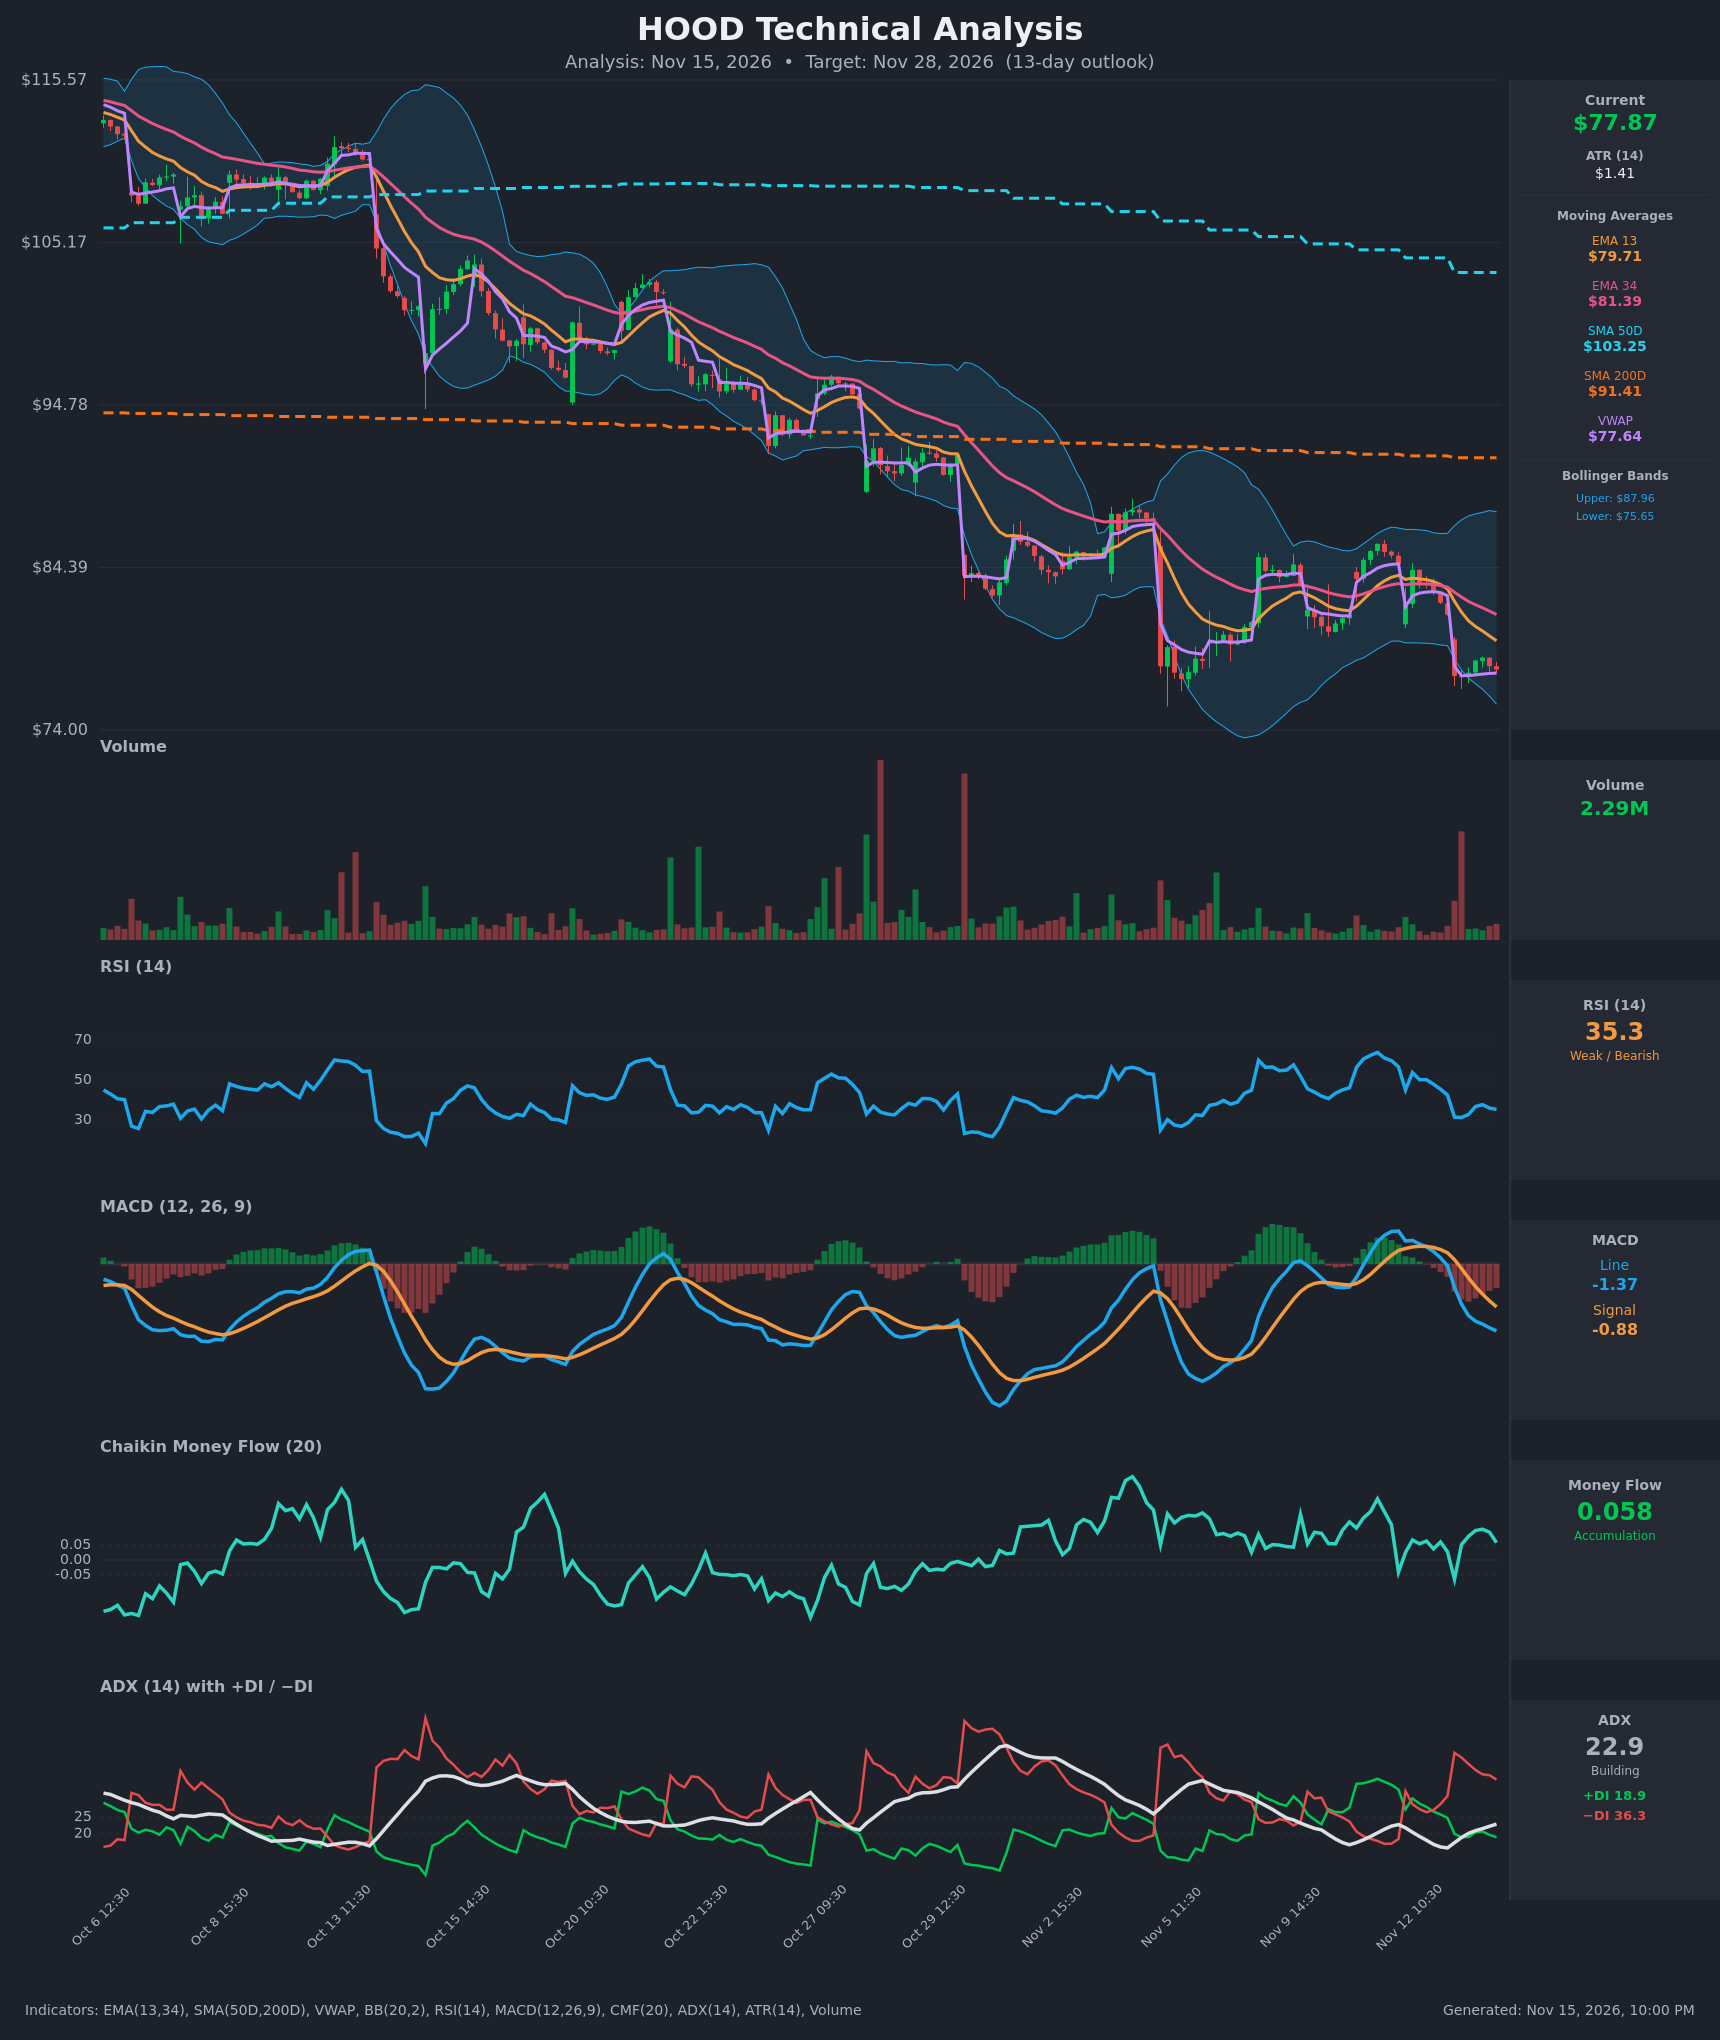
- RSI (14): 35.30, down from the 56 area on Nov 11 and near the oversold line (30), which it touched at 31.3 on Nov 13. It is weak but not yet oversold, with a slight bounce to 37.7 that has since faded. [Bearish]
- 20 EMA: The supplied EMAs are EMA 13 at $79.71 and EMA 34 at $81.39. Price at $77.87 is below both, and the EMA 13 has crossed below the EMA 34 (bearish cross around Nov 12-13). Both slope down and act as overhead resistance. [Bearish]
- MACD: Line -1.37 is below signal -0.88, with a bearish crossover on Nov 12-13. The histogram is negative (about -0.49) and widening, and both lines are heading lower. [Bearish]
- Bollinger Bands (20): Upper $87.96, lower $75.65, so price sits in the lower quarter of the band, about $2.2 above the lower band. The bands are wide, which means volatility is elevated. The price is walking the lower half, and the 20-period midline near $81.8 is resistance. [Bearish]
- CMF (20): 0.058, just above the +0.05 accumulation threshold and positive for several bars. This is a mild divergence against the price decline, hinting at some dip buying, but the reading is marginal. [Accumulation]
- ADX (14): 22.9 and rising from 15.7, with −DI (36.3) well above +DI (18.9). The trend is just becoming established, and bears are clearly in control. [Moderate Trend – Bearish]
- Volume: 2.29M on the latest bar, which is average-to-light. There was a heavy-volume spike on the Nov 13 gap-down, and the bounce volume afterward has been thin. Selling pressure showed up on the breakdown and buying interest has been weak. [Bearish confirmation on the breakdown]
DIVERGENCES & TRENDS
- Price is in a clear long-term downtrend. It is far below the SMA50D ($103.25), which is itself falling, and below the SMA200D ($91.41). The SMA50D crossed below the SMA200D earlier, a death cross, so the structure remains bearish.
- The EMA 13 has crossed below the EMA 34, and the MACD has crossed below its signal line. Both are fresh bearish crossovers.
- A mild bullish divergence exists in CMF, which is positive (0.058) while price makes lower lows. It is not confirmed by RSI or MACD, which are still making lower readings.
- Price is just above VWAP ($77.64), so VWAP is the immediate support line. Holding it gives a small bounce, and losing it opens the lower Bollinger Band.
- A gap-down on Nov 13 (from ~$81 to ~$77.5) left an unfilled gap overhead near $81-82.
- ADX is rising while −DI dominates, which supports further downside rather than a reversal.
CHART PATTERNS
- The reference diagram's closest match is a Bearish Flag / Pennant in the continuation family. The sharp Nov 13 drop is the flagpole, and the small sideways drift near $77-79 is the flag. Price has stayed below the falling EMAs without reclaiming them.
- Bigger picture, the stair-step lower highs and lows since mid-October resemble a Descending Channel, a bearish continuation pattern.
- Measured-move target for the flag: the ~$4 flagpole (from ~$81.4 to ~$77.4) projected from a breakdown below ~$77 gives roughly $73-74.
- The CMF positive reading and RSI near 30 mean a relief bounce toward $80-81 (the EMA cluster and gap fill) is plausible before the next leg down.
POTENTIAL SCENARIOS
- Scenario 1: Bearish Continuation Lower — Price fails at the EMA 13/34 zone, loses VWAP and the lower Bollinger Band, and extends the downtrend as −DI stays dominant. Trigger: close below $77.00 (VWAP/flag low). Target: $72.50 to $74.00. Invalidation: daily close above $81.50 (EMA 34 and gap top). (50% probability)
- Scenario 2: Neutral Oversold Bounce then Stall — RSI near 30 and positive CMF lead to a relief bounce that fills part of the gap and stalls at the EMAs, so price ends the period close to current levels. Trigger: hold of $75.65-$76.00 with a move back above $79.70. Target: $79.50 to $81.00 intraperiod. Invalidation: break below $75.00. (30% probability)
- Scenario 3: Bullish Reversal — Dip buyers (CMF) drive a reclaim of the EMAs and the Bollinger midline, ending the short-term downtrend. Trigger: close above $82.00 on rising volume. Target: $84.50 to $87.00. Invalidation: loss of $77.00 after the move. (20% probability)
PRICE TARGETS
For 13 days, ATR of $1.41 suggests about $5 of typical movement (about ±6%), and the guidance asks for ~8-12% width.
- Target Price: $74.80 (a 13-day bearish drift, about -3.9%)
- Expected Range: $70.50 to $79.50 ($9.00 width, ≈11.6% of current price)
- Key Levels: Support at $75.65 (lower Bollinger Band), Resistance at $79.71 (EMA 13)
OVERALL BIAS
OVERALL BIAS: BEARISH - Price is below all key moving averages with fresh bearish EMA and MACD crossovers, −DI far above +DI with ADX rising, and a death-cross structure, while the marginal CMF and near-oversold RSI argue only for a possible relief bounce, not a trend reversal.
This is educational analysis and not financial advice.