IBIT 13-day bearish forecast — Nov 15, 2026
- Bias: Bearish
- Timeframe: 13 days (made Nov 15, 2026, target date Nov 27, 2026)
- Price at analysis: $38.95
- Price target: $37.60
- Expected range: $35.80 – $39.60
- Result: Pending — graded after the close on Nov 27, 2026
Get a free AI analysis of IBIT today
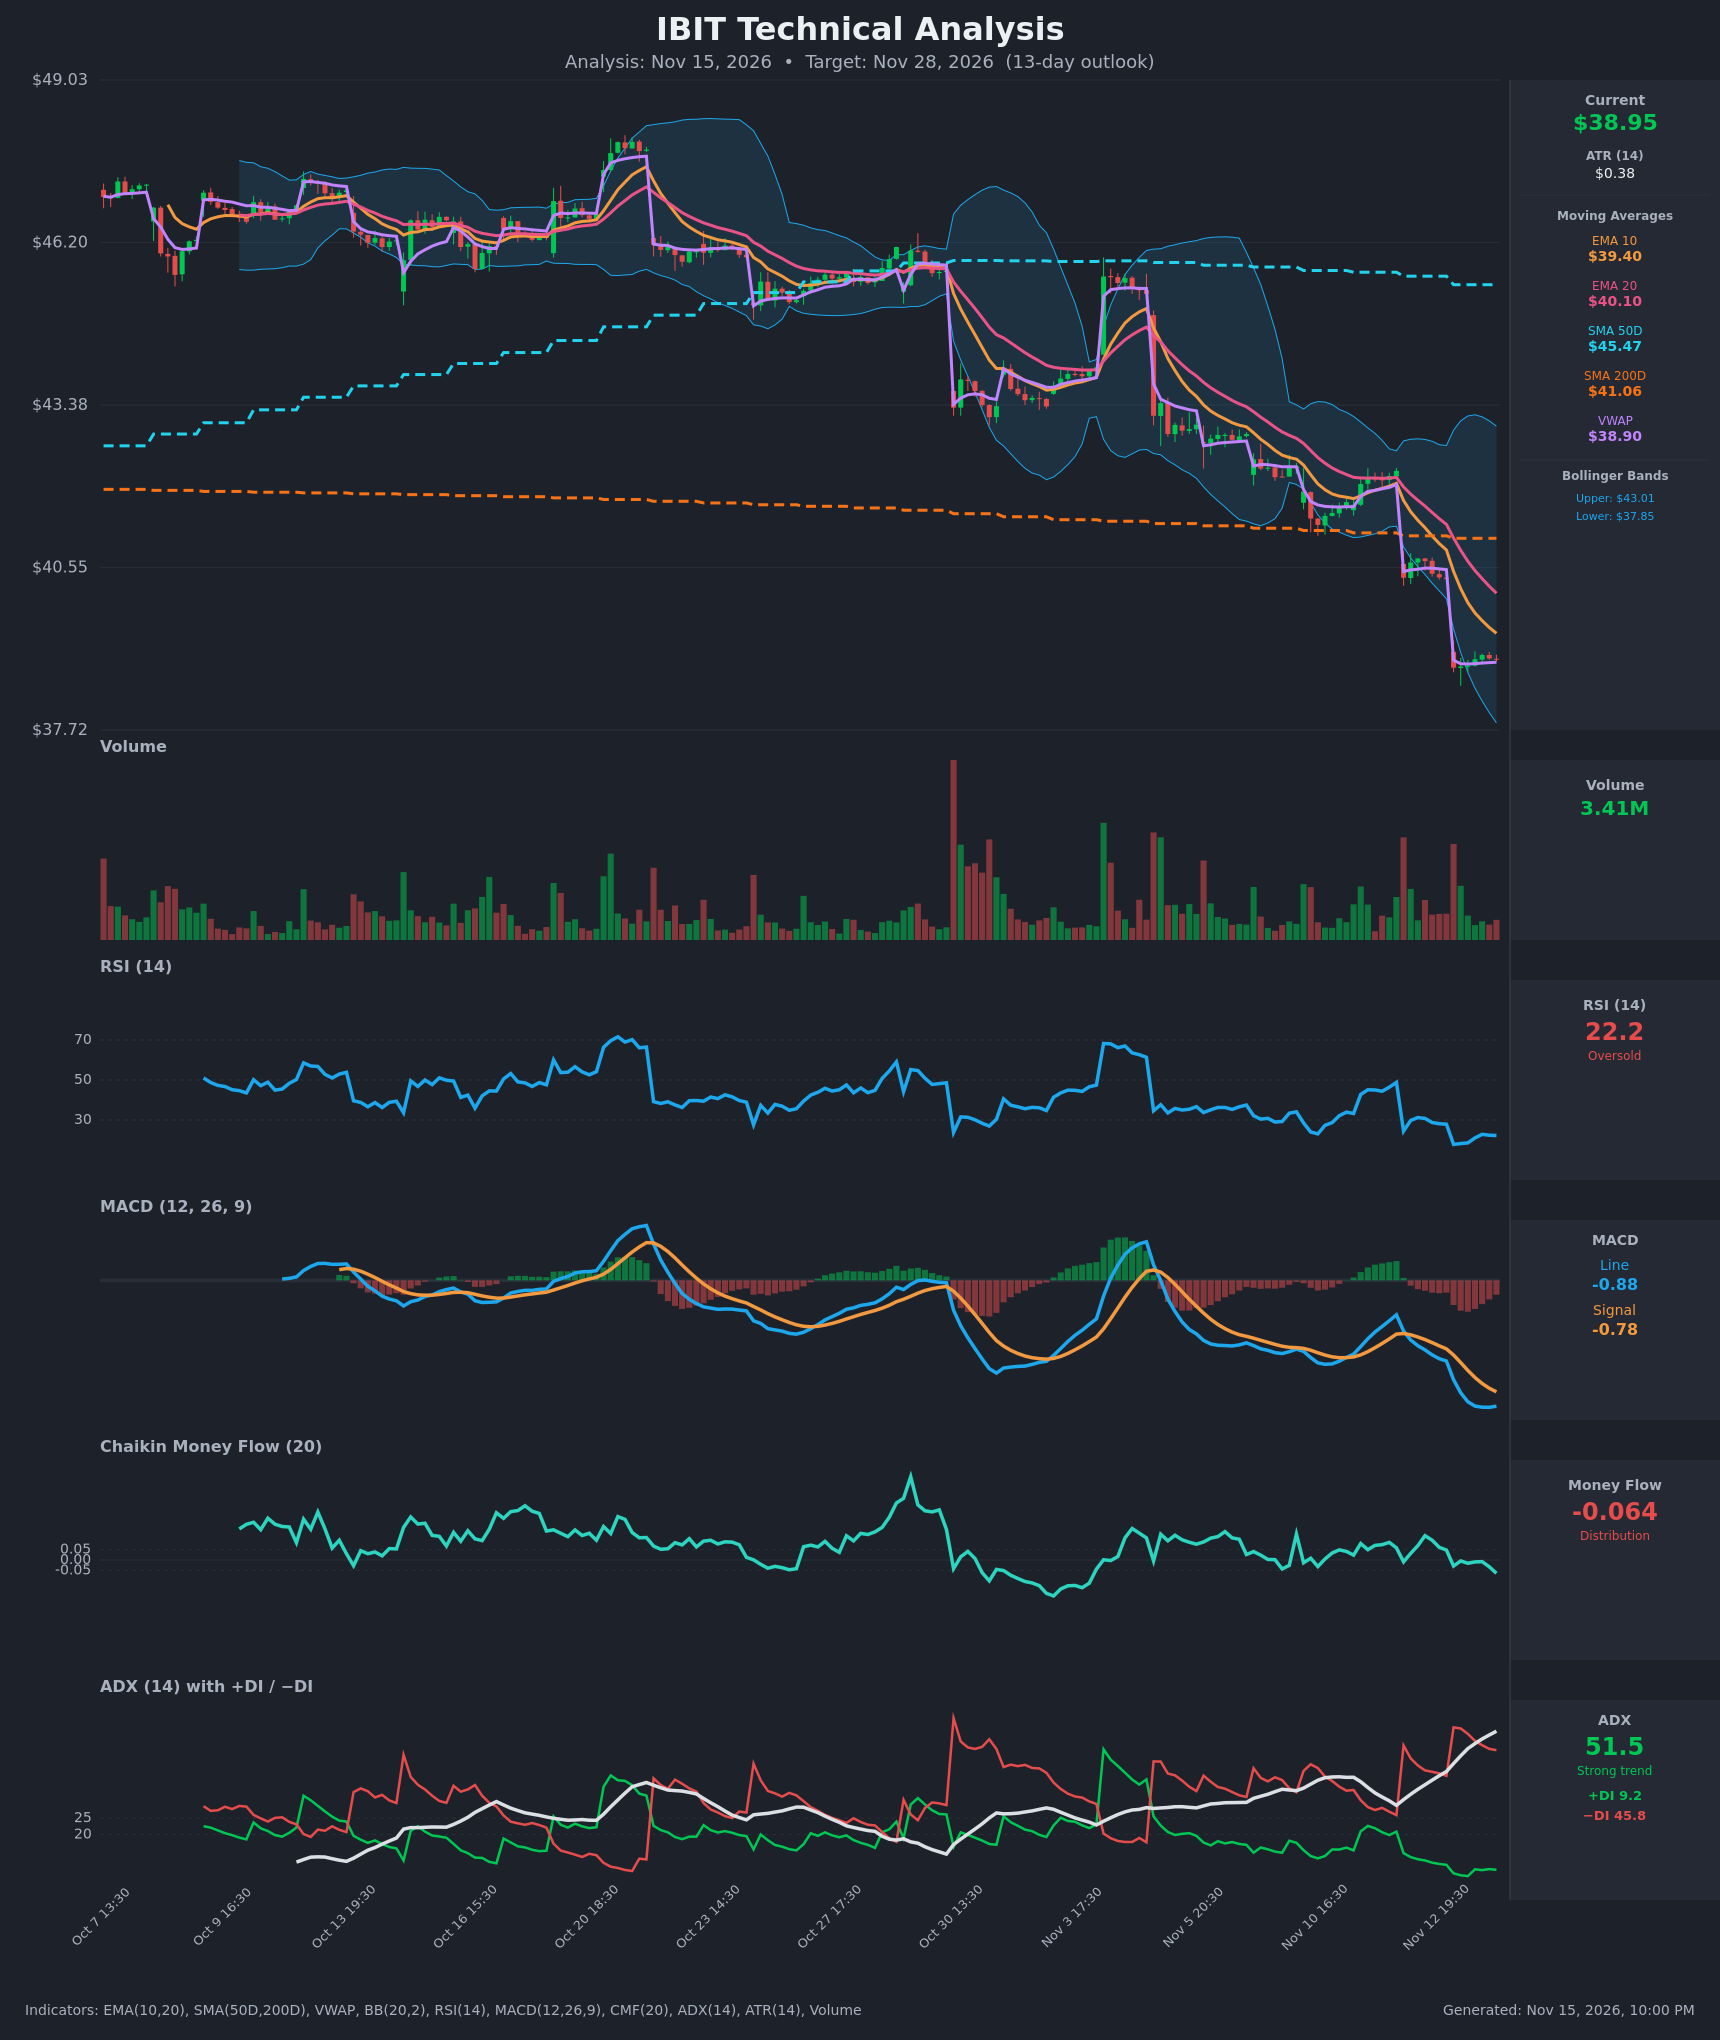
Analysis
TECHNICAL INDICATORS
- RSI (14): 22.24, deep in oversold territory. It touched 17.8 on Nov 13 and has only bounced to the low 20s, so momentum is still pinned at the bottom with no bullish divergence yet. Oversold readings in a strong downtrend can persist, but they raise the odds of a relief bounce. [Bearish]
- 20 EMA: $40.10, with the 10 EMA at $39.40. Price at $38.95 is below both, and EMA10 is below EMA20 and falling every bar. Both EMAs are overhead resistance. [Bearish]
- MACD: Line -0.878 is below Signal -0.778, and the histogram is negative at about -0.10. The line has been below the signal since about Nov 12 and is at its lowest level on the chart. The last two bars show the line flattening, so downside momentum is slowing slightly but has not turned. [Bearish]
- Bollinger Bands (20): Upper $43.01, lower $37.85, so price sits near the lower band, about 2.9% above it. The bands are wide after the gap-downs, and price has been walking the lower band. This is a trend-walk, with a mean-reversion bounce risk toward the $40 midline. [Bearish]
- CMF (20): -0.064, just below the -0.05 threshold and fading from slightly positive readings earlier in the session. This shows mild distribution and no real accumulation under the selloff. [Distribution]
- ADX (14): 51.5 and rising, with -DI at 45.8 and +DI at 9.2. This is a very strong trend, with bears in full control and +DI at a very low level. An ADX above 50 also flags a mature or extended move, so a pause is possible. [Strong Trend – Bearish]
- Volume: 3.41M, modest on the latest bar. The largest volume spikes came on the gap-down legs, and there is no capitulation spike at the current low. Selling has been orderly rather than climactic. [Mildly Bearish / No capitulation]
DIVERGENCES & TRENDS
- Divergences: No bullish RSI or MACD divergence has formed. Price made a lower low at about $38.80 on Nov 13 and the RSI low of 17.8 was marginally lower than the current 22, but this is not a confirmed divergence. A small hint is that RSI has bounced from 17.8 to 22 while price is flat, which could precede a relief bounce.
- Trend: Price is below EMA10, EMA20, SMA200 ($41.06) and SMA50 ($45.47). It has been in a stair-step decline with repeated gap-downs, and it just broke below the SMA200 area.
- MA structure: SMA50 ($45.47) is still above SMA200 ($41.06), so no death cross has occurred yet. SMA50 is rolling over and the gap is narrowing, which makes a death cross a risk over the coming weeks.
- MACD: The bearish crossover happened around Nov 12 and the line is still falling.
- VWAP: Price ($38.95) is essentially at VWAP ($38.90), so there is no edge here. It is neutral to slightly positive.
- DI: -DI has dominated +DI since Nov 12 with no sign of a reversal.
CHART PATTERNS
- Bearish Pennant / Flag (continuation): The tight sideways consolidation around $38.80–$39.02 after the Nov 13 gap-down resembles a small bearish flag or pennant. The measured move from the prior drop (about $40.35 to $38.80) projects roughly $37.2–$37.5 on a breakdown.
- Stair-step decline: The series of gap-downs and lower highs is a broad descending channel, a continuation structure in the Descending Triangle/Bearish Flag family. There is no reversal pattern such as a double bottom or inverted head and shoulders yet.
- Key level: The lower Bollinger Band at about $37.85 is the nearest reference. A break below it opens the path to the mid-$36s.
POTENTIAL SCENARIOS
- Scenario 1: Bearish Trend Continuation — The bearish flag resolves lower and sellers keep control, with price riding the lower Bollinger Band as ADX stays above 40. Trigger: a break and close below $38.80, then $37.85. Target: $37.60, extending to $36.30. Invalidation: a daily close above $40.10 (EMA20). (52% probability)
- Scenario 2: Bullish Oversold Relief Bounce — The RSI is near 22 and price is stretched below the moving averages, so a mean-reversion rally toward the EMAs is likely at some point. Trigger: a push above $39.40 (EMA10) with RSI back above 30 and MACD histogram turning up. Target: $40.10–$41.00 (EMA20 and SMA200 retest). Invalidation: failure at $40.10 and a new low below $38.80. (33% probability)
- Scenario 3: Neutral Base Building — Price stalls and chops around $38–$40 as ADX cools from its extreme. Trigger: low-volume consolidation holding $37.85. Target: $38.50–$39.50. Invalidation: a close outside $37.60–$40.20. (15% probability)
PRICE TARGETS
For the 13-day horizon (through Nov 28, 2026):
- Target Price: $37.60
- Expected Range: $35.80 to $39.60. The width is $3.80, about 9.8% of the current price, consistent with a roughly 2-week timeframe (8–12%).
- Key Levels: Support at $37.85 (lower Bollinger Band), Resistance at $39.40 (EMA10). Beyond that, $40.10 (EMA20) is the next resistance.
OVERALL BIAS
OVERALL BIAS: BEARISH - Price is below all key moving averages, ADX is at 51.5 with -DI dominant, MACD is below its signal line, and CMF shows mild distribution, with a bearish flag consolidation pointing to about $37.5. The extreme oversold RSI (22) means a relief bounce toward $40 is a real risk, but the weight of evidence favors continuation lower.
This is educational analysis and not financial advice.