CRWV 13-day bearish forecast — Nov 15, 2026
- Bias: Bearish
- Timeframe: 13 days (made Nov 15, 2026, target date Nov 27, 2026)
- Price at analysis: $53.11
- Price target: $51.40
- Expected range: $49.80 – $55.20
- Result: Pending — graded after the close on Nov 27, 2026
Get a free AI analysis of CRWV today
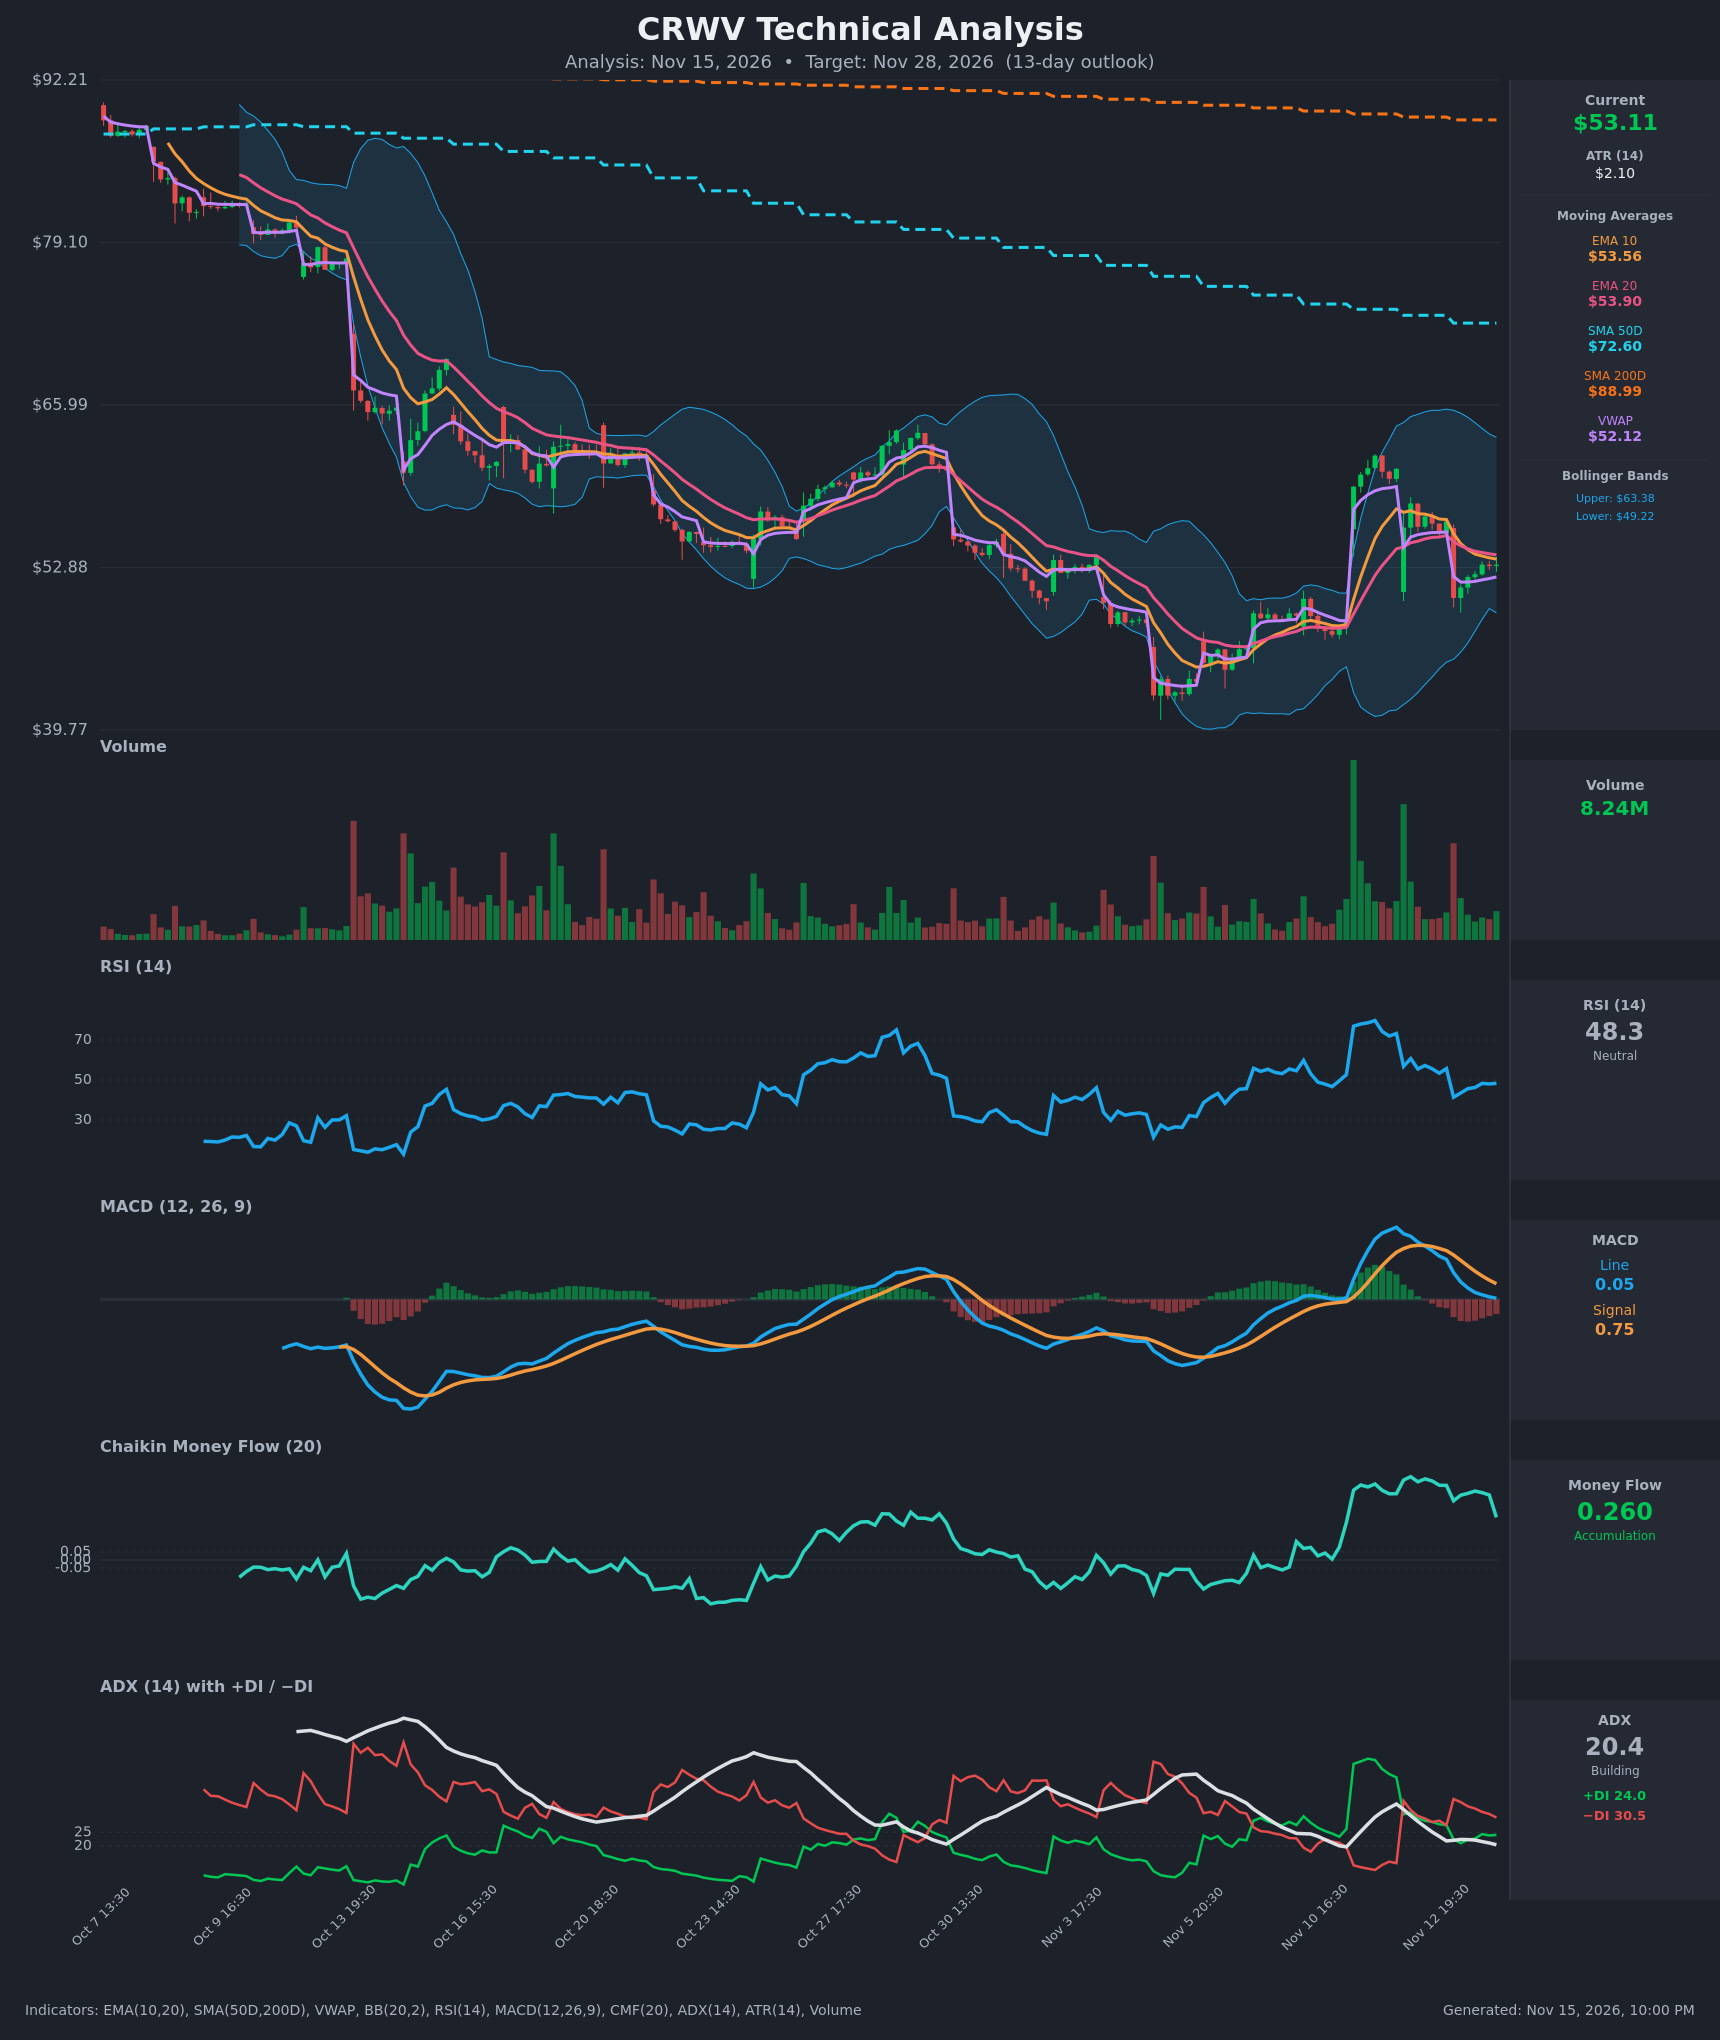
Analysis
TECHNICAL INDICATORS
- RSI (14): 48.35, just under the 50 midline. It fell from 73 on Nov 11 and bottomed near 41 on Nov 13 before stabilizing at 46-48. Momentum has cooled but is not oversold. [Neutral]
- 20 EMA: $53.90, with EMA10 at $53.56. Price at $53.11 is below both, and EMA10 crossed below EMA20 on Nov 13. The EMA20 is now the nearest overhead resistance. [Bearish]
- MACD: Line 0.054 vs signal 0.747, so the line is below the signal after a bearish crossover on Nov 12. The histogram is negative (about -0.69) but the line is flattening, so downside momentum is fading rather than accelerating. [Bearish]
- Bollinger Bands (20): Upper $63.38, lower $49.22, midline roughly $56.3. Price is in the lower half of a wide band, so volatility is elevated after the Nov 11 spike and Nov 13 gap down. The midline is resistance and the lower band is support. [Bearish]
- CMF (20): +0.260, well above +0.05, so accumulation. It has been dropping from about 0.50 to 0.26, and the latest bar showed a sharp one-day decline. Buying pressure is still positive but fading. [Accumulation]
- ADX (14): 20.4 and falling from 35, with −DI (30.5) above +DI (24.0). The trend is weak and the pullback from the Nov 11 spike has lost strength, but bears hold slight directional control. [Weak Trend, bearish lean]
- Volume: 8.24M, modest compared with the large spikes on the Nov 10-12 rally and reversal. The bounce from $50.4 to $53.1 came on light volume, so there is little conviction behind the recovery. [Neutral to mildly bearish]
Moving averages and VWAP:
- Price is far below the SMA50 ($72.60) and SMA200 ($88.99).
- The SMA50 is below the SMA200, a death cross, and both are falling.
- Price is slightly above VWAP ($52.12), a mild near-term positive.
DIVERGENCES & TRENDS
- Long-term trend: A clear downtrend, with price down from about $90 to a low near $41 and trading well below both SMAs. The death-cross structure is intact.
- CMF vs price: CMF is strongly positive while price made lower highs and fell about 12% in two sessions. This is a mild bullish divergence, but CMF is rolling over, so it is not a reliable reversal signal yet.
- MACD: The bearish crossover on Nov 12 was confirmed by the line falling to about zero. A histogram turn-up would be the first sign of stabilization.
- ADX/DI: ADX fell from 35 to 20, so the Nov 11 impulse has exhausted. −DI crossed above +DI on Nov 12, and the gap has narrowed slightly (30.5 vs 24.0).
- EMA10/EMA20: EMA10 crossed below EMA20 on Nov 13, a short-term bearish cross.
- Rally failure: Price failed at about $61 (the Nov 11 high) and gave back the entire rally, a lower high relative to the earlier $65-$66 area.
CHART PATTERNS
- Bearish Pennant / Flag (continuation): After the sharp Nov 13 drop from about $56.6 to $50.4, price is consolidating in a small range of $50.4-$53.5. A break below $50.4 would measure toward the mid-$40s, but the pattern is small and not fully developed.
- Possible Double Bottom (reversal): The lows near $41-$42 (Nov 5) and the base around $50 could form a larger base. The pattern is not confirmed and would need a break above about $61. It is a low-probability alternative within 13 days.
- Broader structure: A sequence of lower highs and lower lows inside a descending channel, with the death cross as a headwind. A rebound toward the EMA20 or the Bollinger midline is likely to face selling.
POTENTIAL SCENARIOS
- Scenario 1: Bearish Pennant Breakdown / Grind Lower — The lower-high structure resumes, with the EMA20 and the negative MACD acting as resistance. Trigger: rejection at $53.90-$54.50 or a close below $52.00 with rising volume. Target: $50.40, then the lower band near $49.20, with an extension toward $47. Invalidation: a daily close above $56.50. (50% probability)
- Scenario 2: Neutral Consolidation — Weak ADX holds price between the Nov 13 low and the EMA20/gap resistance as the volatility spike unwinds. Trigger: failure to break $50.40 or $55.50. Target: $51.50-$54.50. Invalidation: a close outside $49.20-$56.50. (25% probability)
- Scenario 3: Bullish Relief Rally — Positive CMF, price above VWAP, and a MACD histogram turn-up support a rebound to the Bollinger midline. Trigger: a close above $54.50 with volume above 10M. Target: $56.10-$57.50 (Nov 12 area and EMA/midline), possibly $60. Invalidation: a close below $50.40. (25% probability)
PRICE TARGETS
- Target Price: $51.40 (13-day horizon)
- Expected Range: $49.80 to $55.20 (width $5.40, about 10.2% of the current price, in line with the 7-21 day guidance for 13 days)
- Key Levels: Support at $49.22 (lower Bollinger Band, just above the $50.42 Nov 13 low), Resistance at $53.90 (EMA20, with the Bollinger midline near $56.30 above)
OVERALL BIAS
OVERALL BIAS: BEARISH - Price is below the EMA10 and EMA20 and far below the death-crossed SMA50 and SMA200. MACD is below its signal line and −DI leads +DI, while the bounce from $50.4 came on light volume. Fading CMF and the weak ADX limit conviction, so the expected decline is modest, toward $51.40.
This is educational analysis and not financial advice.