GOOGL 13-day bullish forecast — Nov 15, 2026
- Bias: Bullish
- Timeframe: 13 days (made Nov 15, 2026, target date Nov 27, 2026)
- Price at analysis: $295.79
- Price target: $299.50
- Expected range: $284.50 – $311.00
- Result: Pending — graded after the close on Nov 27, 2026
Get a free AI analysis of GOOGL today
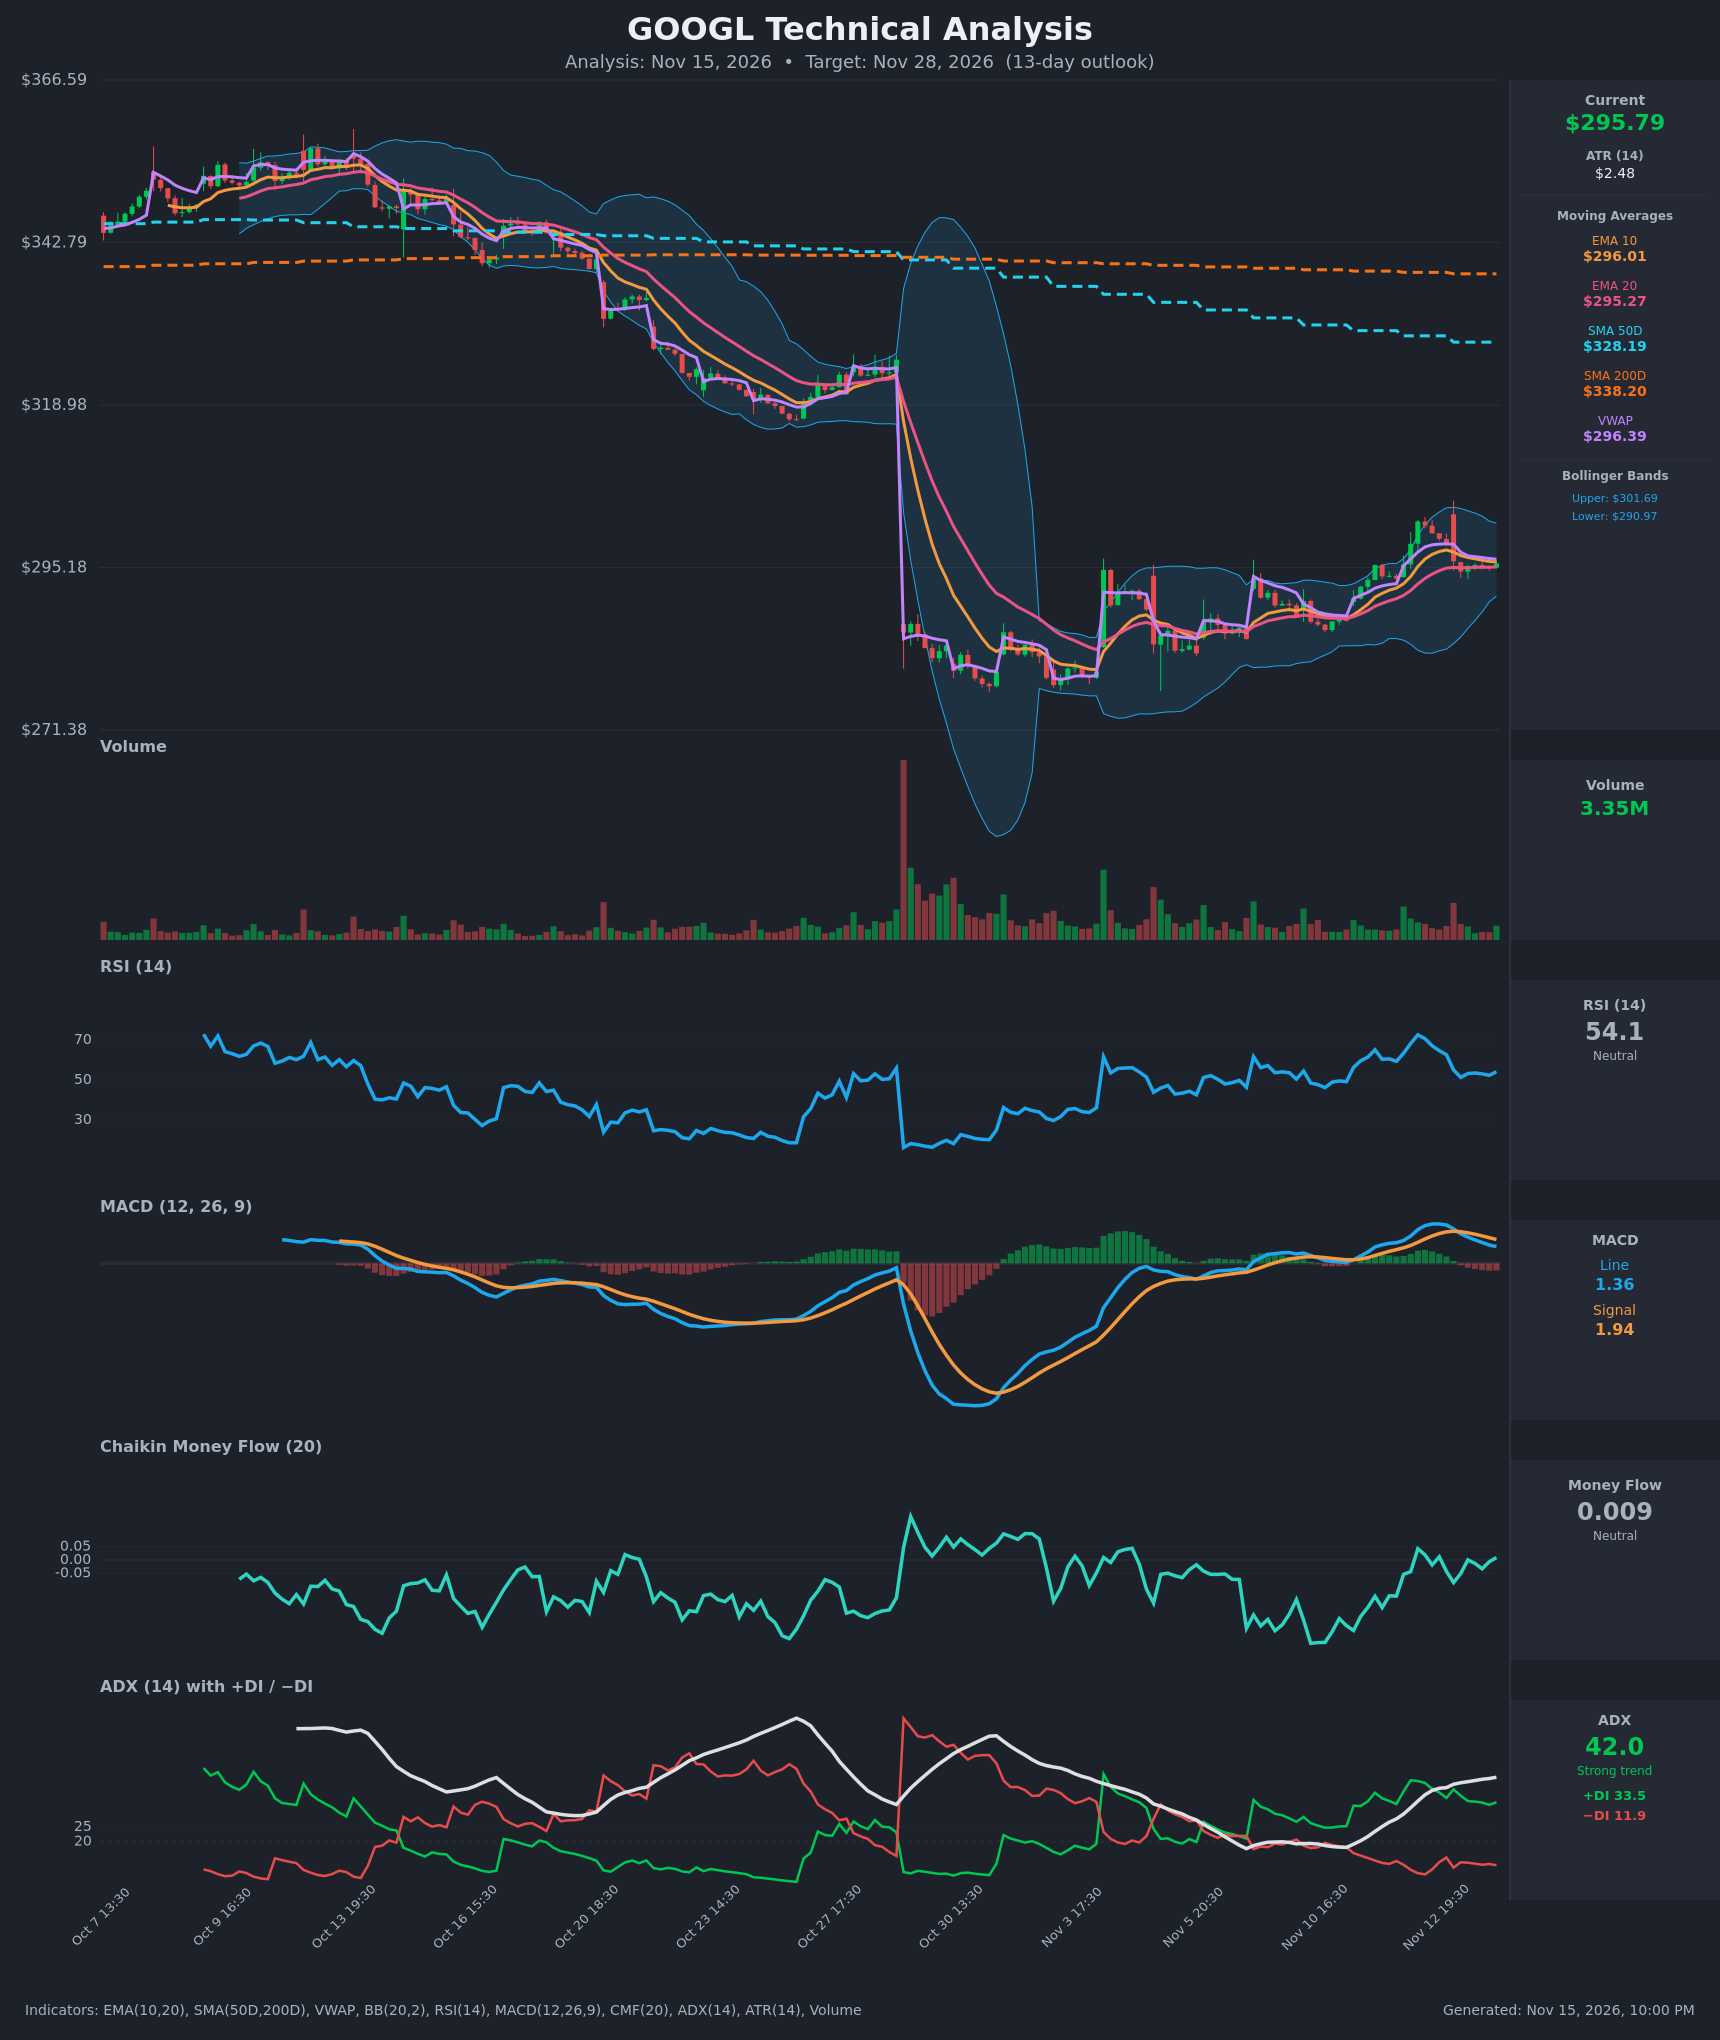
Analysis
TECHNICAL INDICATORS
- RSI (14): 54.13, neutral and cooling from an overbought 72.6 on Nov 12 down to the low 50s. Momentum has reset without breaking below 50. [Neutral]
- 20 EMA: $295.27, with price at $295.79 just above it. EMA10 ($296.01) is only slightly above EMA20, so the short-term uptrend is intact but flattening. Price is holding the EMA20 as dynamic support. [Bullish]
- MACD: Line 1.36 is below the signal at 1.94, and the histogram is negative and widening. The bearish crossover happened on Nov 13 and reflects the pullback from the $302-305 area. The lines are still above zero, so this reads as a pause, not a trend reversal. [Bearish]
- Bollinger Bands (20): Upper $301.69, lower $290.97, with price near the midline (~$296.3). The bands have contracted from the earlier blowout, which signals a volatility squeeze and a likely expansion. Price is pinned mid-band with no directional edge. [Neutral]
- CMF (20): 0.009, inside the ±0.05 neutral zone. It has oscillated around zero for about a week after improving from -0.135, so there is neither accumulation nor distribution. [Neutral]
- ADX (14): 42.0 and rising, with +DI 33.5 over −DI 11.9. This is a strong trend with bulls clearly in control. The ADX rise reflects the rally off the ~$280 lows, and +DI has eased from 41. [Strong Trend + Bullish]
- Volume: 3.35M, which is light and below the earlier capitulation spike. The pullback from $305 came on modest volume, so there is no heavy distribution. The rally also lacked big volume expansion. [Neutral / mildly constructive]
DIVERGENCES & TRENDS
- Price has gone sideways to slightly lower since Nov 12, while RSI fell from 72.6 to 54 and MACD rolled over. This is momentum cooling in a pullback, not a classic divergence.
- The price lows since the Oct 30 gap-down have been rising (~$280 → ~$283 → ~$288-291), while ADX and +DI stay elevated. That is a constructive higher-low structure.
- MACD crossed down on Nov 13, a short-term bearish signal. EMA10 and EMA20 have not crossed down, though they are converging.
- Price is far below SMA50 ($328.19) and SMA200 ($338.20), and SMA50 is already below SMA200 (a death cross in place). The long-term trend is still down, and those averages are heavy overhead resistance well beyond this horizon.
- VWAP ($296.39) sits slightly above price, a minor sign of intraday seller control.
CHART PATTERNS
- Bullish Double Bottom (developing): Lows at roughly $280-283 (Oct 30 / Nov 3-4) with a neckline around $301-305, which is the Nov 12 high zone. A close above that zone would project toward the mid-$320s, near the SMA50. That target is beyond 13 days.
- Bullish Flag / Pennant (minor): The Nov 12 rally to ~$302-305 was followed by a tight, low-volume pullback and consolidation around $295. A break above ~$301.7 would resolve it upward.
- Counter-risk: A failure to hold $291 would turn the structure into a lower-high range under the declining SMAs, which resembles a bearish continuation of the larger downtrend.
POTENTIAL SCENARIOS
- Scenario 1: Bullish Flag Breakout — Price holds the EMA20 and the lower Bollinger Band area, the squeeze resolves upward, and +DI dominance carries price through the recent highs. Trigger: close above $301.70 on rising volume with MACD re-crossing above signal. Target: $305-$308. Invalidation: close below $290.97. (45% probability)
- Scenario 2: Neutral Range Consolidation — Price chops between $291 and $302 as the squeeze persists and MACD resets toward zero. Trigger: failure to break either Bollinger Band. Target: $294-$298. Invalidation: close outside $290-$303. (25% probability)
- Scenario 3: Bearish Failure Back to Lows — The MACD bearish crossover extends, price loses the EMA20 and the lower band, and sellers push back toward the base. Trigger: close below $290.97 with expanding volume. Target: $283-$286. Invalidation: reclaim of $298 on a closing basis. (30% probability)
PRICE TARGETS
- Target Price: $299.50 (13-day horizon)
- Expected Range: $284.50 to $311.00 (width $26.50, about 9% of the current price, consistent with the 8-12% guidance for 13-21 days)
- Key Levels: Support at $290.97, Resistance at $301.69
OVERALL BIAS
OVERALL BIAS: BULLISH - Strong ADX (42) with +DI far above −DI, price holding the EMA10/EMA20, and a higher-low base after the gap-down favor an upside resolution of the Bollinger squeeze. The bearish MACD crossover, the position below the SMA50/SMA200, and neutral CMF cap conviction at modest.
This is educational analysis and not financial advice.