AMZN 13-day bullish forecast — Nov 15, 2026
- Bias: Bullish
- Timeframe: 13 days (made Nov 15, 2026, target date Nov 27, 2026)
- Price at analysis: $266.61
- Price target: $271.50
- Expected range: $259.00 – $282.00
- Result: Pending — graded after the close on Nov 27, 2026
Get a free AI analysis of AMZN today
Analysis
TECHNICAL INDICATORS
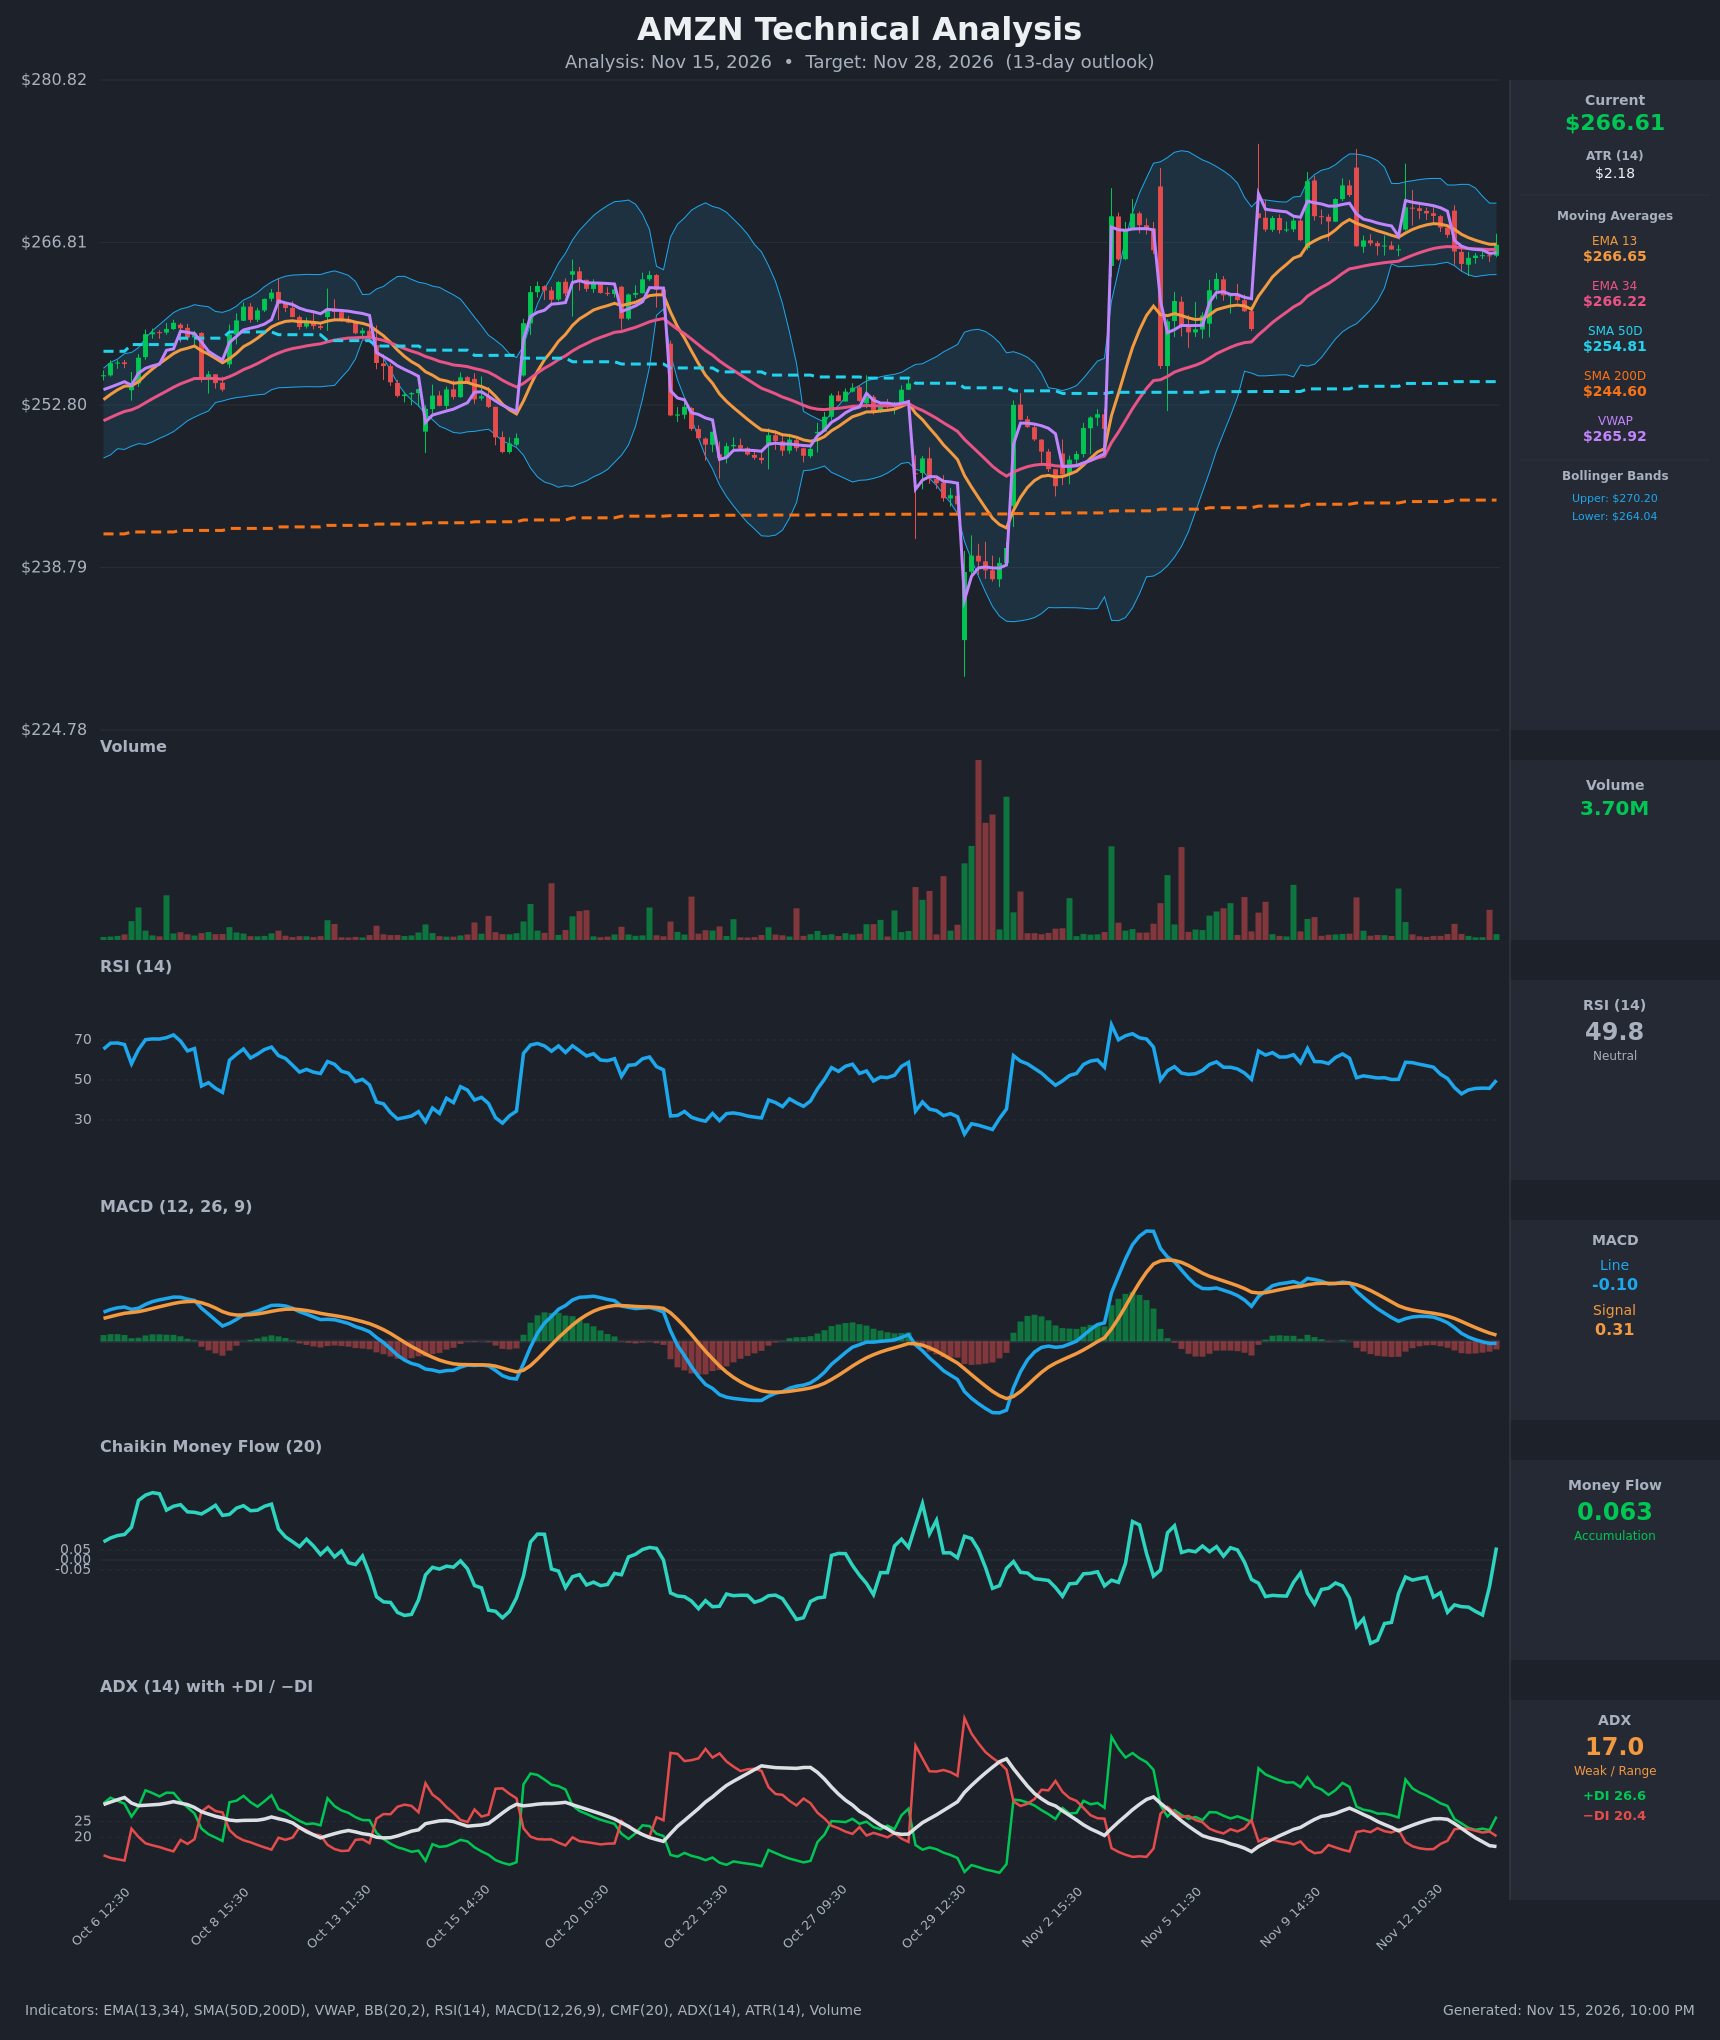
- RSI (14): 49.84, dead neutral. It has bounced from 43.1 (Nov 13 10:30) after falling from 58.9 on Nov 12. Momentum is stabilizing, with no overbought or oversold signal. [Neutral]
- 20 EMA (EMA 13 / EMA 34 used): EMA13 is $266.65 and EMA34 is $266.22. Price at $266.61 is hugging both. EMA13 is still above EMA34, but the gap has narrowed from about $2.05 to $0.43 over the last 15 bars, so a bearish cross is close. Both averages are flat and act as a pivot, not clear support or resistance. [Neutral]
- MACD: Line -0.10 is below Signal 0.31, so the bearish crossover happened around Nov 13 13:30. The histogram is about -0.41 and has narrowed from -0.53 over the last bars, which suggests downside momentum is fading. [Bearish]
- Bollinger Bands (20): Upper $270.20, lower $264.04, mid around $267.12. Price sits just below the midline in a moderately narrow band after the Nov 12 high near the upper band. The bands are contracting, which points to coiling volatility, with no band-walk. [Neutral]
- CMF (20): 0.063, up sharply from -0.276 two bars earlier. It has just crossed into accumulation, though it was negative for most of the past two weeks, so the reading is fresh and needs confirmation. [Accumulation]
- ADX (14): 17.0 and falling, so the trend is weak and range-bound. +DI 26.6 is back above −DI 20.4 after a brief bearish flip around Nov 13 10:30. The bulls have a slight edge in a low-trend-strength environment. [Weak Trend, Bullish lean]
- Volume: 3.70M, about average to below average. Volume has been subdued during the last two sessions of pullback and consolidation, which suggests no aggressive distribution. Price is above VWAP ($265.92) by about $0.69. [Neutral to mildly Bullish]
Longer-term context: price is above SMA50 ($254.81) and SMA200 ($244.60), and SMA50 is above SMA200, so the structure is a bullish long-term trend with no new cross.
DIVERGENCES & TRENDS
- Price vs RSI: Price made a slightly lower high around the Nov 12 peak, and RSI fell from 58.9 to 43 before bouncing. There is no meaningful divergence, just a healthy cooling-off.
- CMF vs price: CMF jumped from -0.276 to +0.063 in two bars as price recovered off $264.96. This early bullish divergence from the Nov 13 low (money flow turning up while price is still flat) is worth watching.
- MACD: The bearish crossover is in place, but the shrinking negative histogram and the proximity of the line to zero suggest momentum is bottoming. A recross above the signal line would be a bullish trigger.
- ADX/DI: ADX has dropped from 25.9 to 17.0, so the pullback is losing energy. The +DI/−DI cross back to +DI on top is a modestly bullish shift.
- EMA compression: EMA13 and EMA34 are converging at the current price. A move away from this squeeze is likely within days.
- Trend: Price has made higher lows since the Oct 29 low (~$232) and has consolidated between about $264 and $273 since the Nov 3 gap-up.
CHART PATTERNS
- Bullish Flag / Pennant (continuation): After the sharp impulse from the late-October low and the Nov 3 gap, price has been consolidating in a narrowing, slightly downward-drifting range of about $264 to $270 with contracting Bollinger Bands and declining ADX. This resembles the Bullish Flag/Pennant from the reference. The measured-move target is the flagpole height added to the breakout point, which is well above current levels. A more conservative target is the prior swing highs around $273 to $275.
- Alternative reading: The Nov 12 rejection near $270 could form a minor Double Top if $264 fails. Price would have to close below $264 on volume to confirm it. The pattern is not confirmed.
- Significance: A breakout above $270.20 with volume would activate the continuation target. A break below $264 would negate the flag.
POTENTIAL SCENARIOS
- Scenario 1: Bullish Flag Breakout — Consolidation resolves upward as CMF stays positive, +DI stays above −DI, and MACD recrosses above signal. Trigger: close above $270.20 (upper Bollinger Band), ideally on above-average volume. Target: $273 to $277, with an extension to about $280. Invalidation: close below $264 (lower band and recent swing low). (50% probability)
- Scenario 2: Bearish Breakdown / EMA Death Cross — The MACD bearish crossover and EMA13 slipping below EMA34 lead to a break of the lower band and a pullback toward SMA50 support. Trigger: close below $264.04 with CMF turning negative again. Target: $258 to $255 (near SMA50 at $254.81). Invalidation: reclaim of $268 with rising CMF. (30% probability)
- Scenario 3: Neutral Range Chop — Weak ADX keeps price rotating between $264 and $270 for most of the period. Trigger: repeated failures at both band edges with ADX staying below 20. Target: $264 to $270. Invalidation: a decisive close outside the range. (20% probability)
PRICE TARGETS
Timeframe: 13 days (Nov 28, 2026). The expected range width is $23.00, about 8.6% of the current price, which fits the 8-12% guidance for roughly two weeks.
- Target Price: $271.50 (13-day, about +1.8%)
- Expected Range: $259.00 to $282.00
- Key Levels: Support at $264.04, Resistance at $270.20
OVERALL BIAS
OVERALL BIAS: BULLISH - Price is above both SMA50 and SMA200 in a bullish long-term structure, CMF has turned positive, +DI is back above −DI, and the consolidation resembles a bullish flag with fading MACD downside momentum. Conviction is modest because ADX is weak and the MACD is still below its signal line.
This is educational analysis and not financial advice.