DELL 13-day bearish forecast — Nov 15, 2026
- Bias: Bearish
- Timeframe: 13 days (made Nov 15, 2026, target date Nov 27, 2026)
- Price at analysis: $344.36
- Price target: $333.00
- Expected range: $319.00 – $347.00
- Result: Pending — graded after the close on Nov 27, 2026
Get a free AI analysis of DELL today
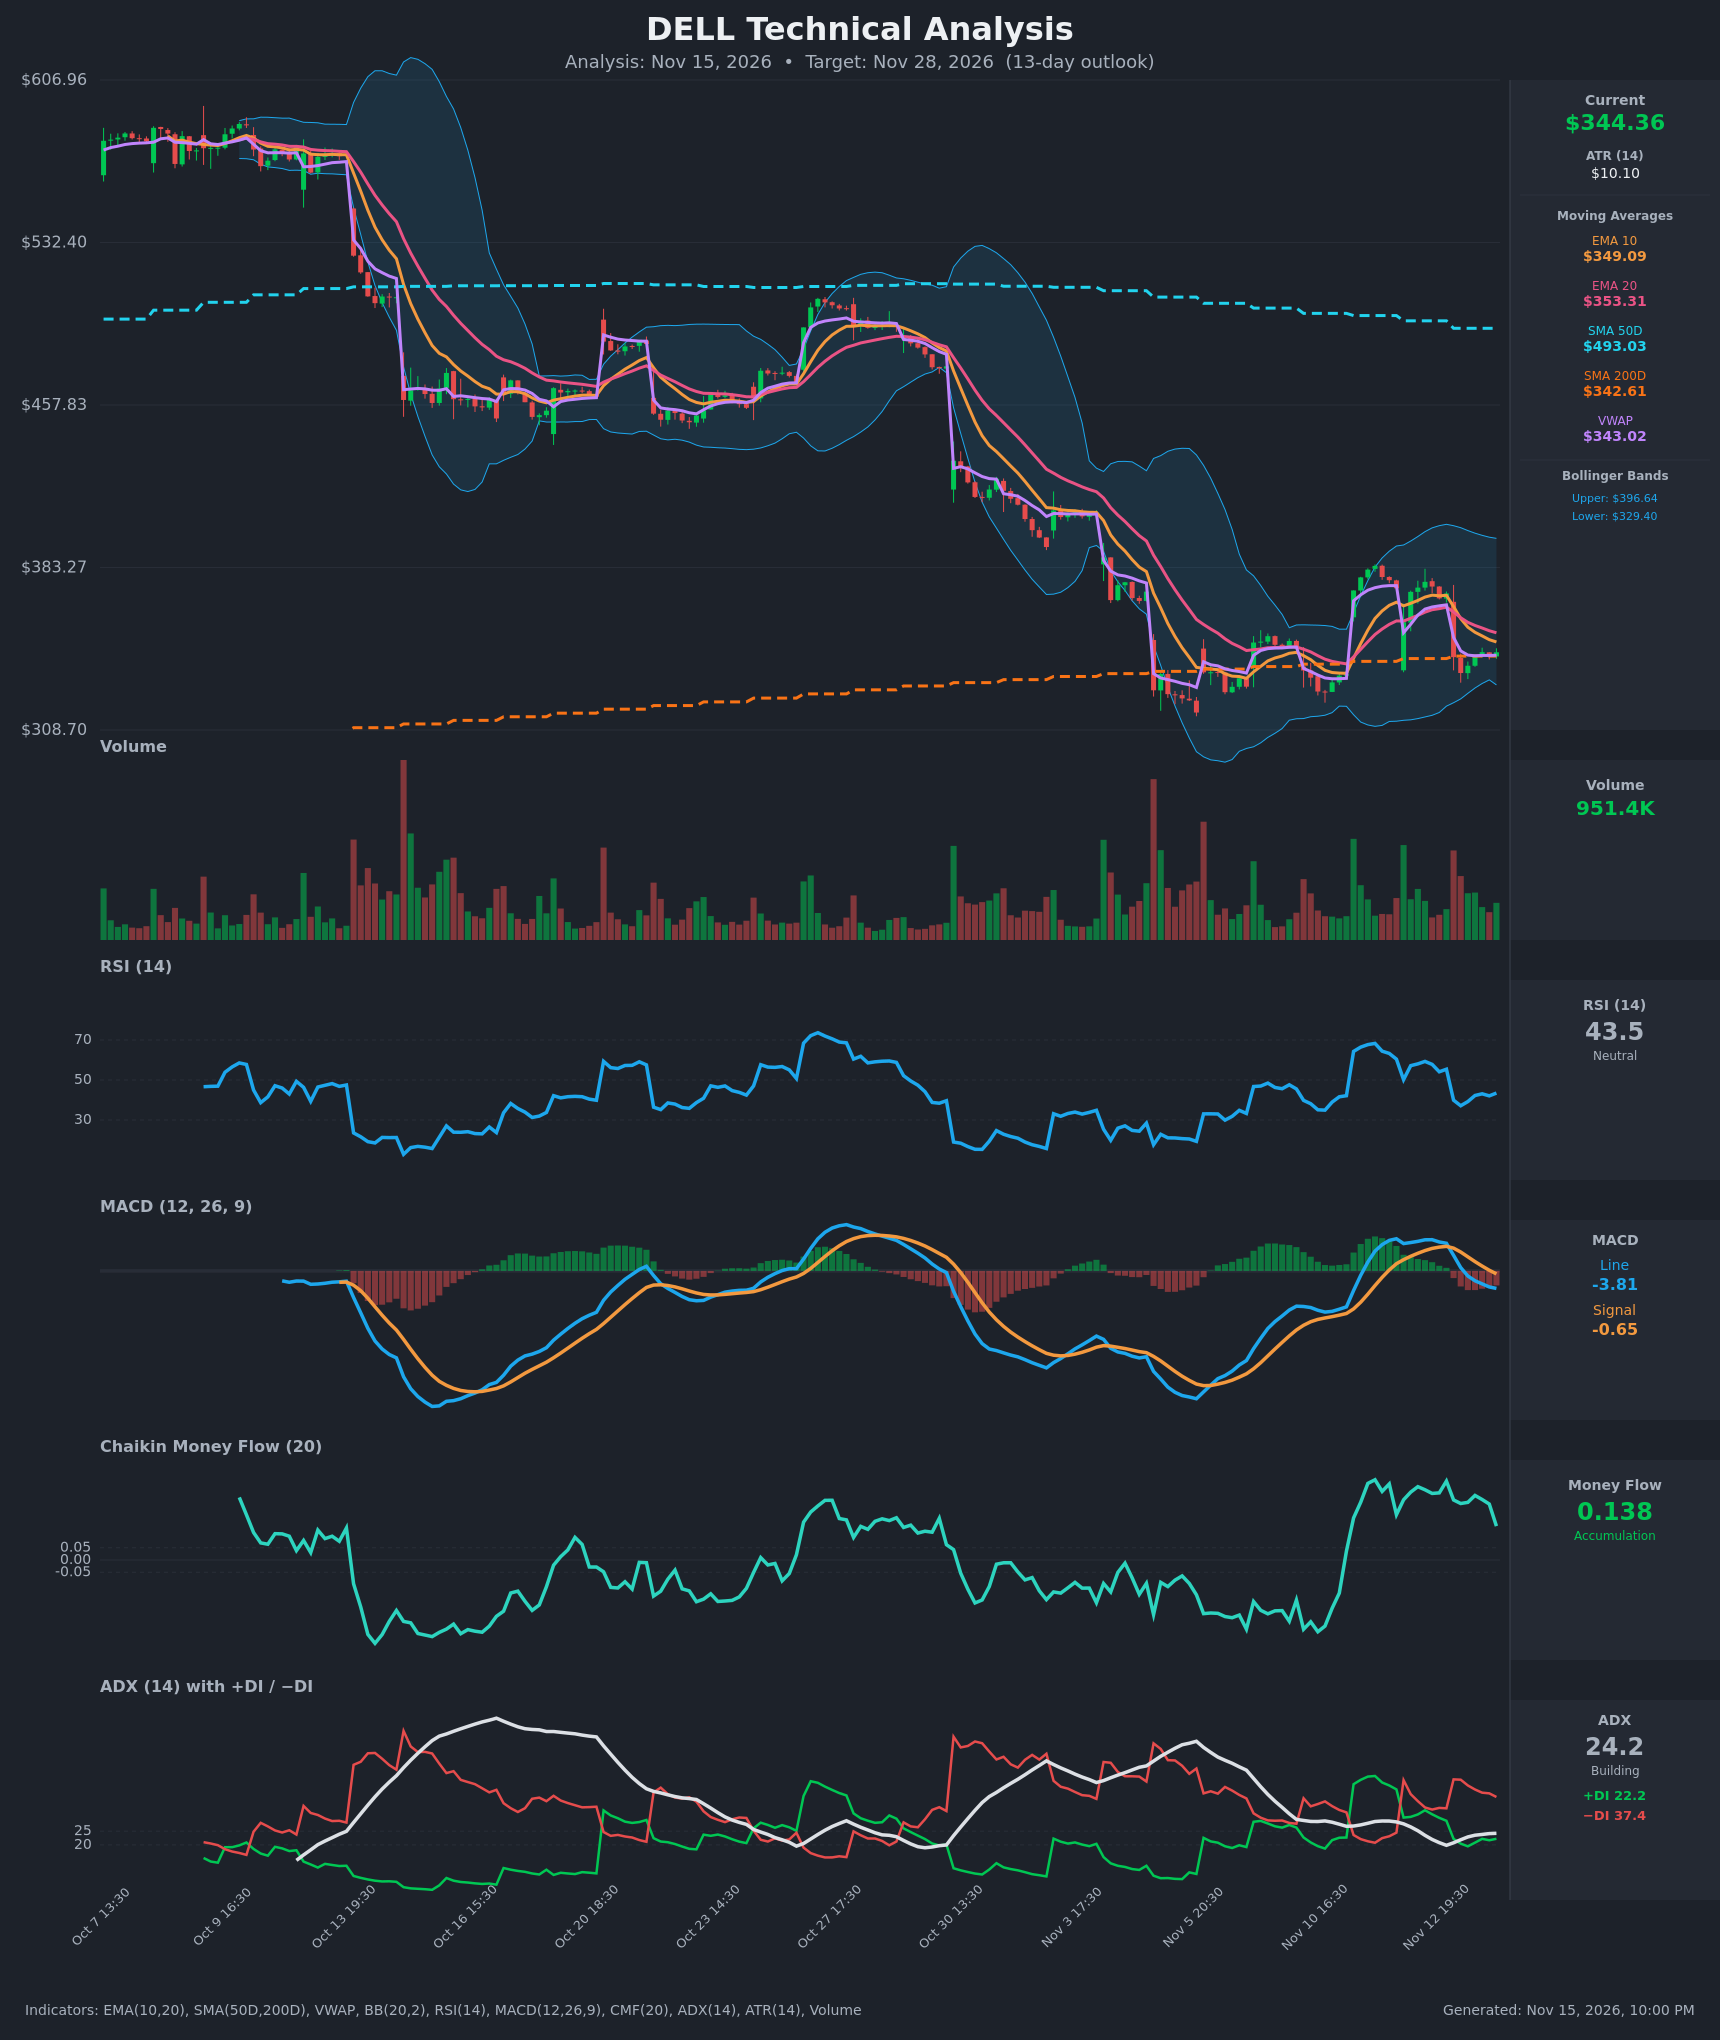
Analysis
TECHNICAL INDICATORS
- RSI (14): 43.47, down from the high-50s on Nov 12 and a 37 low on Nov 13. It sits below 50 but is not oversold, so there is room to fall further before a bounce signal appears. [Bearish]
- 20 EMA: $353.31, with the 10 EMA at $349.09 below it, so the shorter average is already under the longer one. Price at $344.36 is below both, so they act as overhead resistance. The EMA10/EMA20 gap has been widening since Nov 13. [Bearish]
- MACD: The line (-3.81) crossed below the signal (-0.65) and went negative on Nov 13. The histogram is negative and expanding, from +1.5 to roughly -3.2 over the last 8 bars. This is a fresh bearish crossover with accelerating downside momentum. [Bearish]
- Bollinger Bands (20): Upper $396.64, lower $329.40, midline about $363. Price sits in the lower third of the bands (%B around 0.22), below the midline. The bands are still wide after the earlier volatility, so a tag of the lower band near $329 is possible within the window. [Bearish]
- CMF (20): 0.138, above the +0.05 accumulation threshold but falling from 0.32 on Nov 12. Buying pressure is fading, though it has not flipped to distribution. [Accumulation]
- ADX (14): 24.2 and rising, just under the 25 trend threshold. −DI (37.4) is far above +DI (22.2), so sellers control the trend, which is strengthening. [Strong Trend – Bearish]
- Volume: 951.4K, moderate. The heaviest recent volume came on the Nov 13 selloff candles, which suggests sellers were more motivated than buyers. Subsequent bars have been lighter, consistent with a pause at support. [Neutral to Mildly Bearish]
Other levels from the data:
- SMA 200D: $342.61, essentially at price. This is the key long-term support, and price is hugging it.
- SMA 50D: $493.03, far above price and still declining, so the long-term structure is a downtrend. The 50D is well above the 200D, so there is no death cross, but the gap is closing.
- VWAP: $343.02, essentially at price, a neutral pivot.
DIVERGENCES & TRENDS
- CMF vs. price: CMF stays positive while price falls, a mild bullish divergence. It is weakening though (0.32 → 0.138), so it has not yet confirmed a reversal.
- RSI: Price made a lower high at about $385 against the earlier $400+ area. RSI has not yet made a clear higher low, so there is no confirmed bullish RSI divergence.
- MACD and DI: MACD crossed bearish, and −DI crossed back above +DI on Nov 13. The two signals agree.
- ADX: It bottomed near 20 and is turning up as −DI dominates, which points to a developing bearish trend.
- Moving averages: The EMA10 is rolling over beneath the EMA20 and price is below both. The big picture is a series of lower highs since the early-October breakdown from about $570.
CHART PATTERNS
- Descending staircase / lower highs: After the two large gap-downs, price made lower highs ($385 area) and is retesting the $335–$345 support zone. This resembles a Bearish Flag/Pennant continuation structure. A close below roughly $329–$335 would project toward the $315 area, the prior swing low, and possibly lower.
- Potential Bullish Double Bottom: Lows around $315–$335 (early Nov and again Nov 13) could form a double bottom, with a neckline near $385. That target is far away and needs a reclaim of the $353–$363 area first, so it is a lower-probability read.
- Price is pinned on the SMA200 and VWAP, so a break of $342 and then $329 would be the decisive bearish trigger.
POTENTIAL SCENARIOS
- Scenario 1: Bearish Breakdown Below the 200D — Price fails to hold the SMA200/VWAP zone and slides to the lower Bollinger Band, with MACD and −DI continuing to favor sellers. Trigger: hourly close below $335, then below $329.40. Target: $325–$333, with an extension to about $315. Invalidation: close above $353.31 (EMA20). (50% probability)
- Scenario 2: Bullish Bounce off the 200D — Support at the SMA200 and the lower band holds, CMF accumulation persists, and price rebounds toward the EMAs. Trigger: reclaim of $353 on rising volume. Target: $360–$365 (BB midline). Invalidation: close below $329. (30% probability)
- Scenario 3: Neutral Chop at Support — Price oscillates around the SMA200 and VWAP between about $330 and $352. Trigger: ADX falls back below 20 with no decisive break. Target: $338–$348. Invalidation: close outside $329–$353. (20% probability)
PRICE TARGETS
- Target Price: $333.00 (13-day)
- Expected Range: $319.00 to $347.00 (width $28 ≈ 8.1% of current price, appropriate for a 13-day horizon)
- Key Levels: Support at $329.40, Resistance at $353.31
OVERALL BIAS
OVERALL BIAS: BEARISH - A fresh bearish MACD crossover, −DI well above +DI with ADX rising, price below both EMAs, and a long-term downtrend (SMA50 far above price) outweigh the fading CMF accumulation. The SMA200 is the last major support, and a break of it opens the way toward $329 and lower.
This is educational analysis and not financial advice.