IBM 13-day bullish forecast — Nov 15, 2026
- Bias: Bullish
- Timeframe: 13 days (made Nov 15, 2026, target date Nov 27, 2026)
- Price at analysis: $247.19
- Price target: $250.50
- Expected range: $238.00 – $258.50
- Result: Pending — graded after the close on Nov 27, 2026
Get a free AI analysis of IBM today
Analysis
TECHNICAL INDICATORS
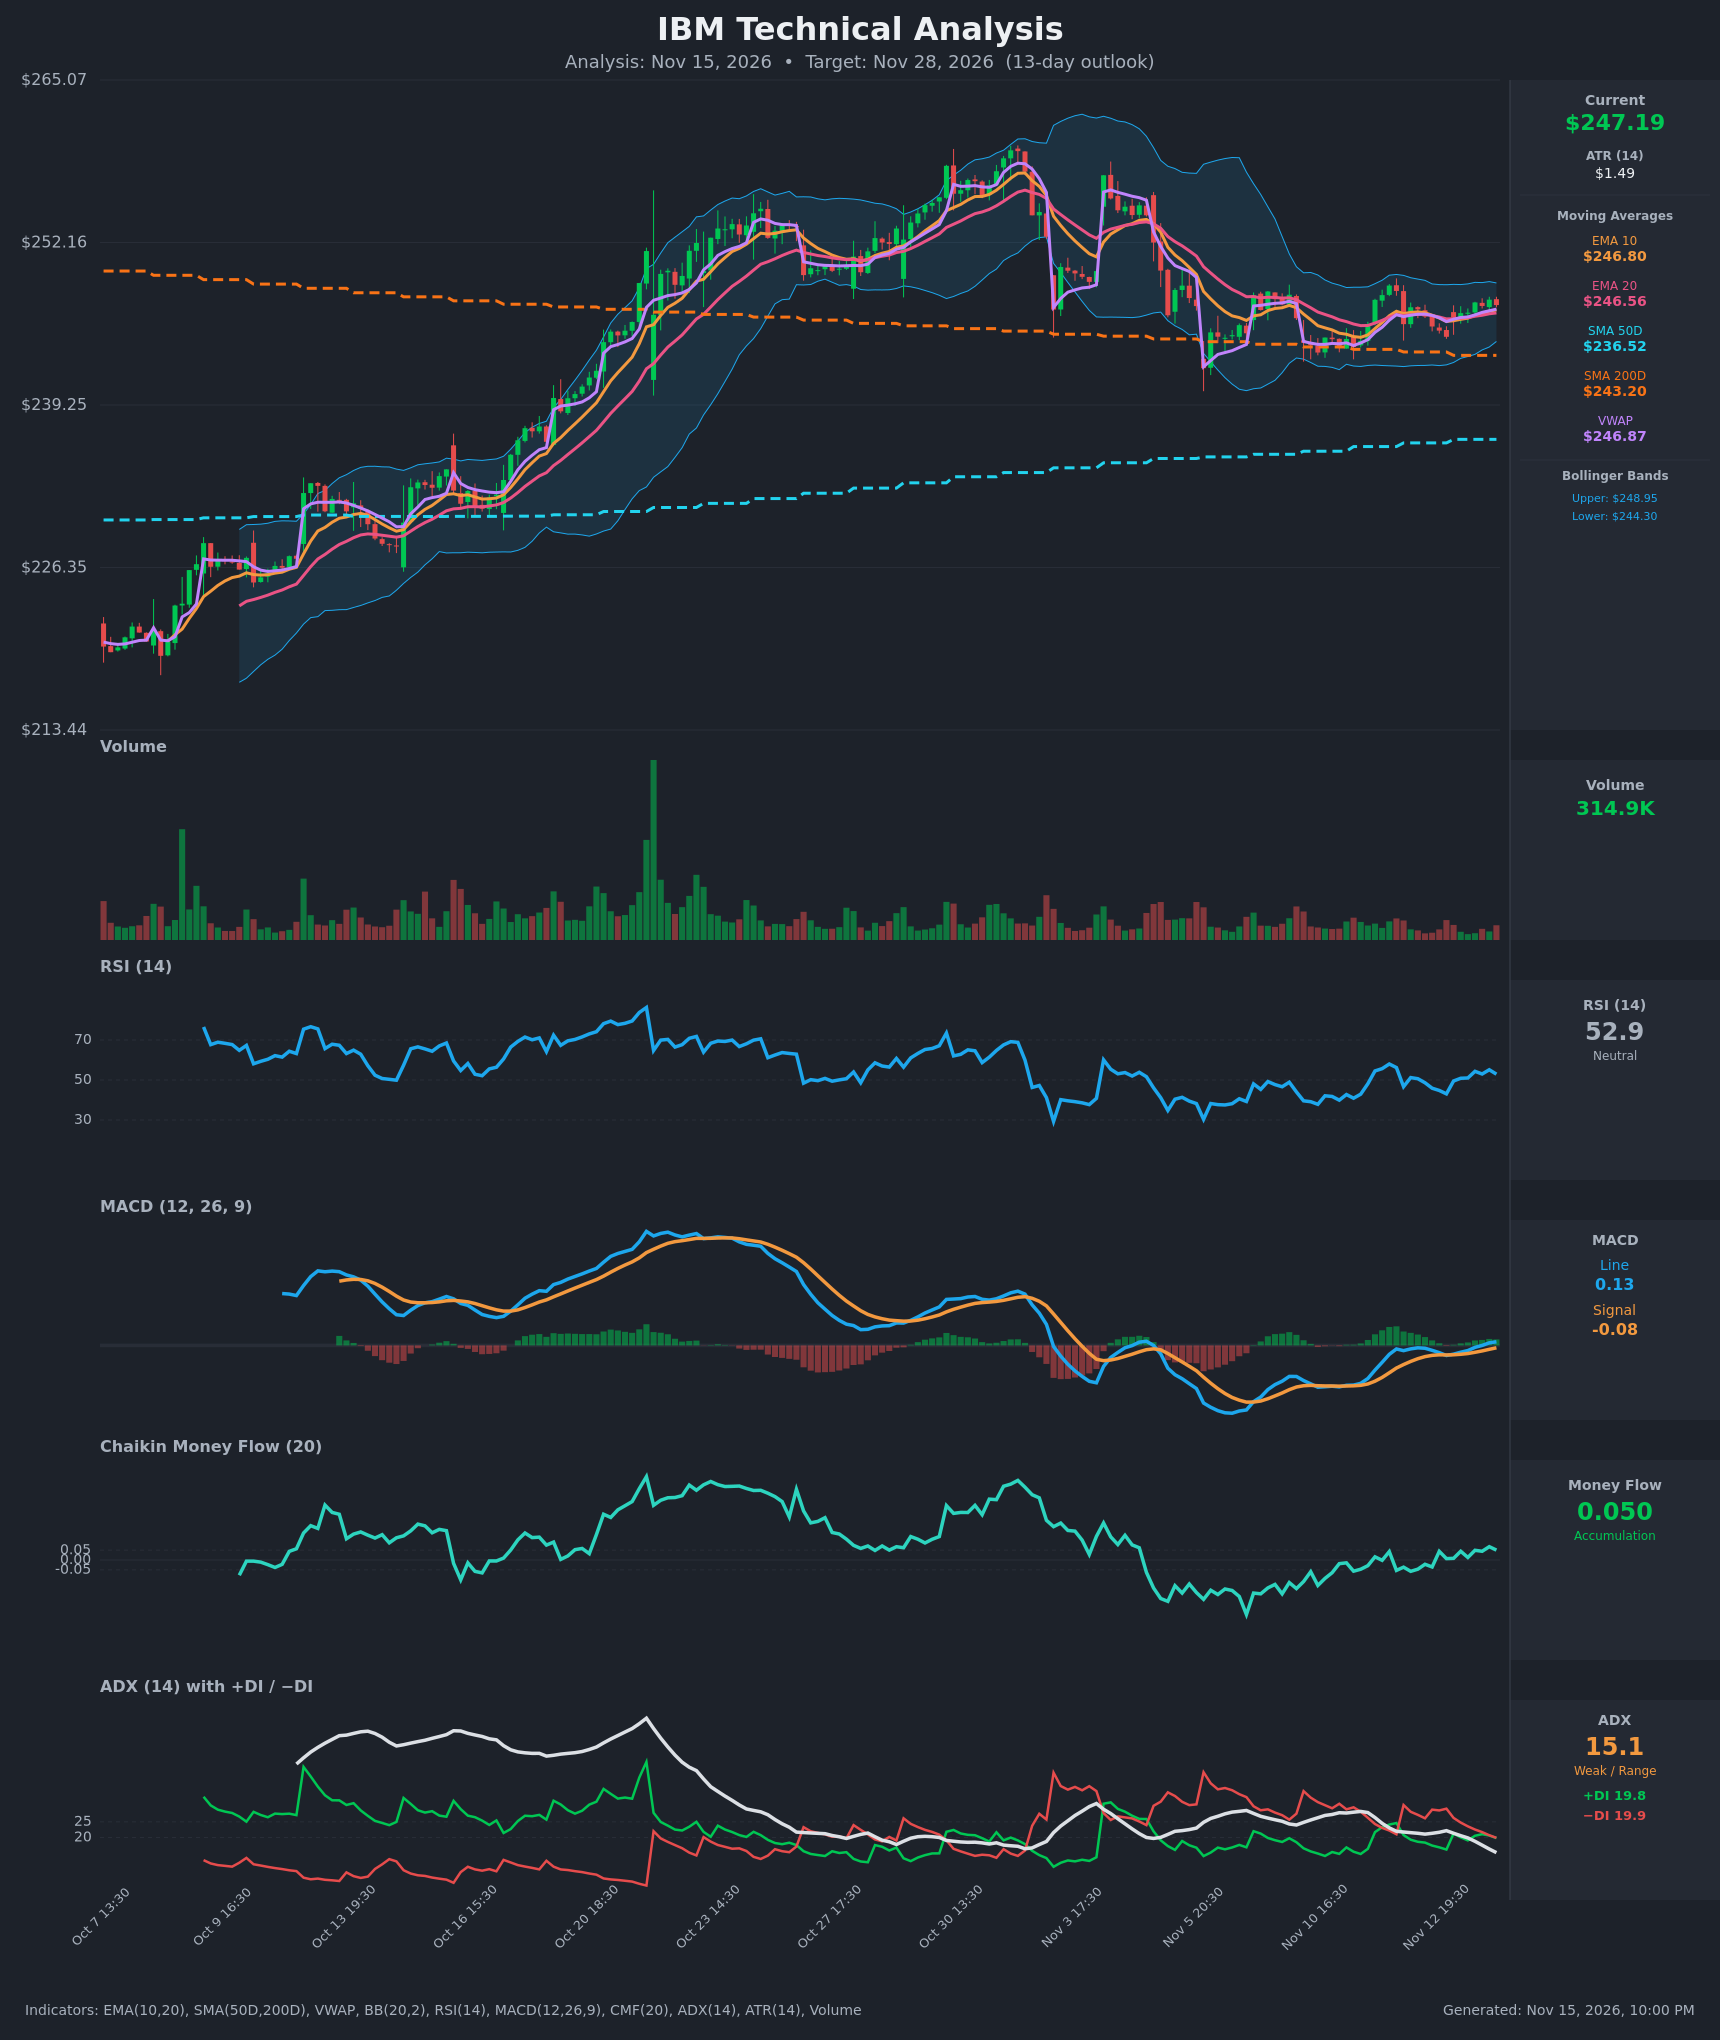
- RSI (14): 52.91, near the midline. It has recovered from 43.1 on Nov 12 and is making higher lows, but it has not broken out of the 45–55 band. [Neutral]
- 20 EMA: $246.56, with price ($247.19) just above it. EMA10 ($246.80) is above EMA20, so the short-term bias is mildly up and the EMAs are acting as support. They sit very close together, which points to a flat, consolidating market. [Bullish]
- MACD: Line 0.129 is above Signal -0.084. It crossed up on Nov 13 (-0.001 vs -0.195, then 0.092 vs -0.138) and the histogram is positive and expanding. This is a fresh bullish momentum cross, but it sits near the zero line and is not yet decisive. [Bullish]
- Bollinger Bands (20): Upper $248.95, lower $244.30, so the bands are narrow after the early-November volatility. Price is in the upper half of the bands, above the midline (about $246.6). The squeeze suggests a directional move is building, and the upper band at $248.95 is the first test. [Bullish]
- CMF (20): 0.050, right on the accumulation threshold and recovering from the deeply negative readings of late October and early November. Buying pressure is improving but not yet strong. [Accumulation]
- ADX (14): 15.1 and falling, which signals a weak, range-bound trend. +DI 19.8 and −DI 19.9 are essentially tied, and −DI has dominated recently but is converging, so neither side is in control. [Weak Trend, no clear direction]
- Volume: 314.9K on the latest bar, light compared with the late-October spikes. Volume has been fading during the consolidation, so there is no conviction yet either way. A volume expansion on a breakout would be the confirming signal. [Neutral / low participation]
Other context:
- VWAP: price is above VWAP ($246.87), which is a slight positive.
- SMA50D / SMA200D: price is above both (SMA50D $236.52, SMA200D $243.20). SMA50D is still below SMA200D, so the longer-term cross is bearish, but SMA50D is rising and the gap is narrowing.
DIVERGENCES & TRENDS
- There is no meaningful price/indicator divergence. RSI, MACD and CMF are all making higher lows alongside a base in price near $244–245.
- MACD turned up from its November trough (about -0.9) and crossed above the signal line. The histogram is positive and rising, which is early momentum improvement.
- CMF climbed from about -0.15 to +0.05, a shift from distribution to mild accumulation.
- ADX has dropped from the mid-20s to 15, so the trend has faded. This favors a base or consolidation, and the up move will lack follow-through unless ADX turns up.
- The EMA10/EMA20 and price/VWAP are tangled, a hallmark of chop. EMA10 is above EMA20 and price is above both, a modest bullish edge.
- Price has been pinned under the declining SMA200D area (about $243) and has held above it since the Nov 5–6 low near $241. This is a key long-term pivot.
CHART PATTERNS
- Primary: Bullish Pennant / small base after a sharp drop. After the early-November drop from about $253 to $241, price has formed a tight, narrowing consolidation between about $244 and $249. It resembles a Symmetrical Triangle / Pennant, with the lower bound rising from the $241 low and the upper bound near $248–249. Narrowing Bollinger Bands support this reading.
- Secondary: Rectangle range. Support is around $244.3 and resistance around $249–252.
- Target: a breakout above $249 would point to the $252–253 supply zone (prior highs and the Nov 4–5 rebound). A measured move could reach about $255. A breakdown below $244.3 would target the SMA200D at $243.20, then $241.
- Significance is moderate. ADX is weak and volume is thin, so a clean breakout is not yet confirmed.
POTENTIAL SCENARIOS
- Scenario 1: Bullish Breakout From Consolidation — Fresh MACD bullish cross, price above EMAs and VWAP, and CMF turning positive point to an upside break of the narrowing range. Trigger: close above $249 (upper Bollinger Band) with rising volume. Target: $252–$255. Invalidation: close back below $244.30. (50% probability)
- Scenario 2: Neutral Range Persistence — Weak ADX keeps price chopping between $244 and $249 for most of the period. Trigger: repeated rejections near $249 and holds above $244.5. Target: $245–$248. Invalidation: a decisive close outside $243.2–$250. (30% probability)
- Scenario 3: Bearish Breakdown — Failure at the upper band, with −DI retaking control and CMF slipping back below -0.05. Trigger: close below $244.30 and then the SMA200D at $243.20. Target: $240–$241. Invalidation: reclaim of $247.5 on strong volume. (20% probability)
PRICE TARGETS
- Target Price: $250.50 (13-day horizon)
- Expected Range: $238.00 to $258.50 (width $20.50, about 8.3% of price, consistent with the 8–12% guidance for a roughly two-week window)
- Key Levels: Support at $244.30, Resistance at $252.00
OVERALL BIAS
OVERALL BIAS: BULLISH - A fresh bullish MACD crossover, price above the EMAs and VWAP, CMF recovering to the accumulation threshold, and higher lows in RSI favor an upside resolution of the narrowing consolidation, though weak ADX and thin volume keep conviction modest.
This is educational analysis and not financial advice.