MSFT 13-day bullish forecast — Nov 15, 2026
- Bias: Bullish
- Timeframe: 13 days (made Nov 15, 2026, target date Nov 27, 2026)
- Price at analysis: $524.31
- Price target: $532.00
- Expected range: $508.00 – $548.00
- Result: Pending — graded after the close on Nov 27, 2026
Get a free AI analysis of MSFT today
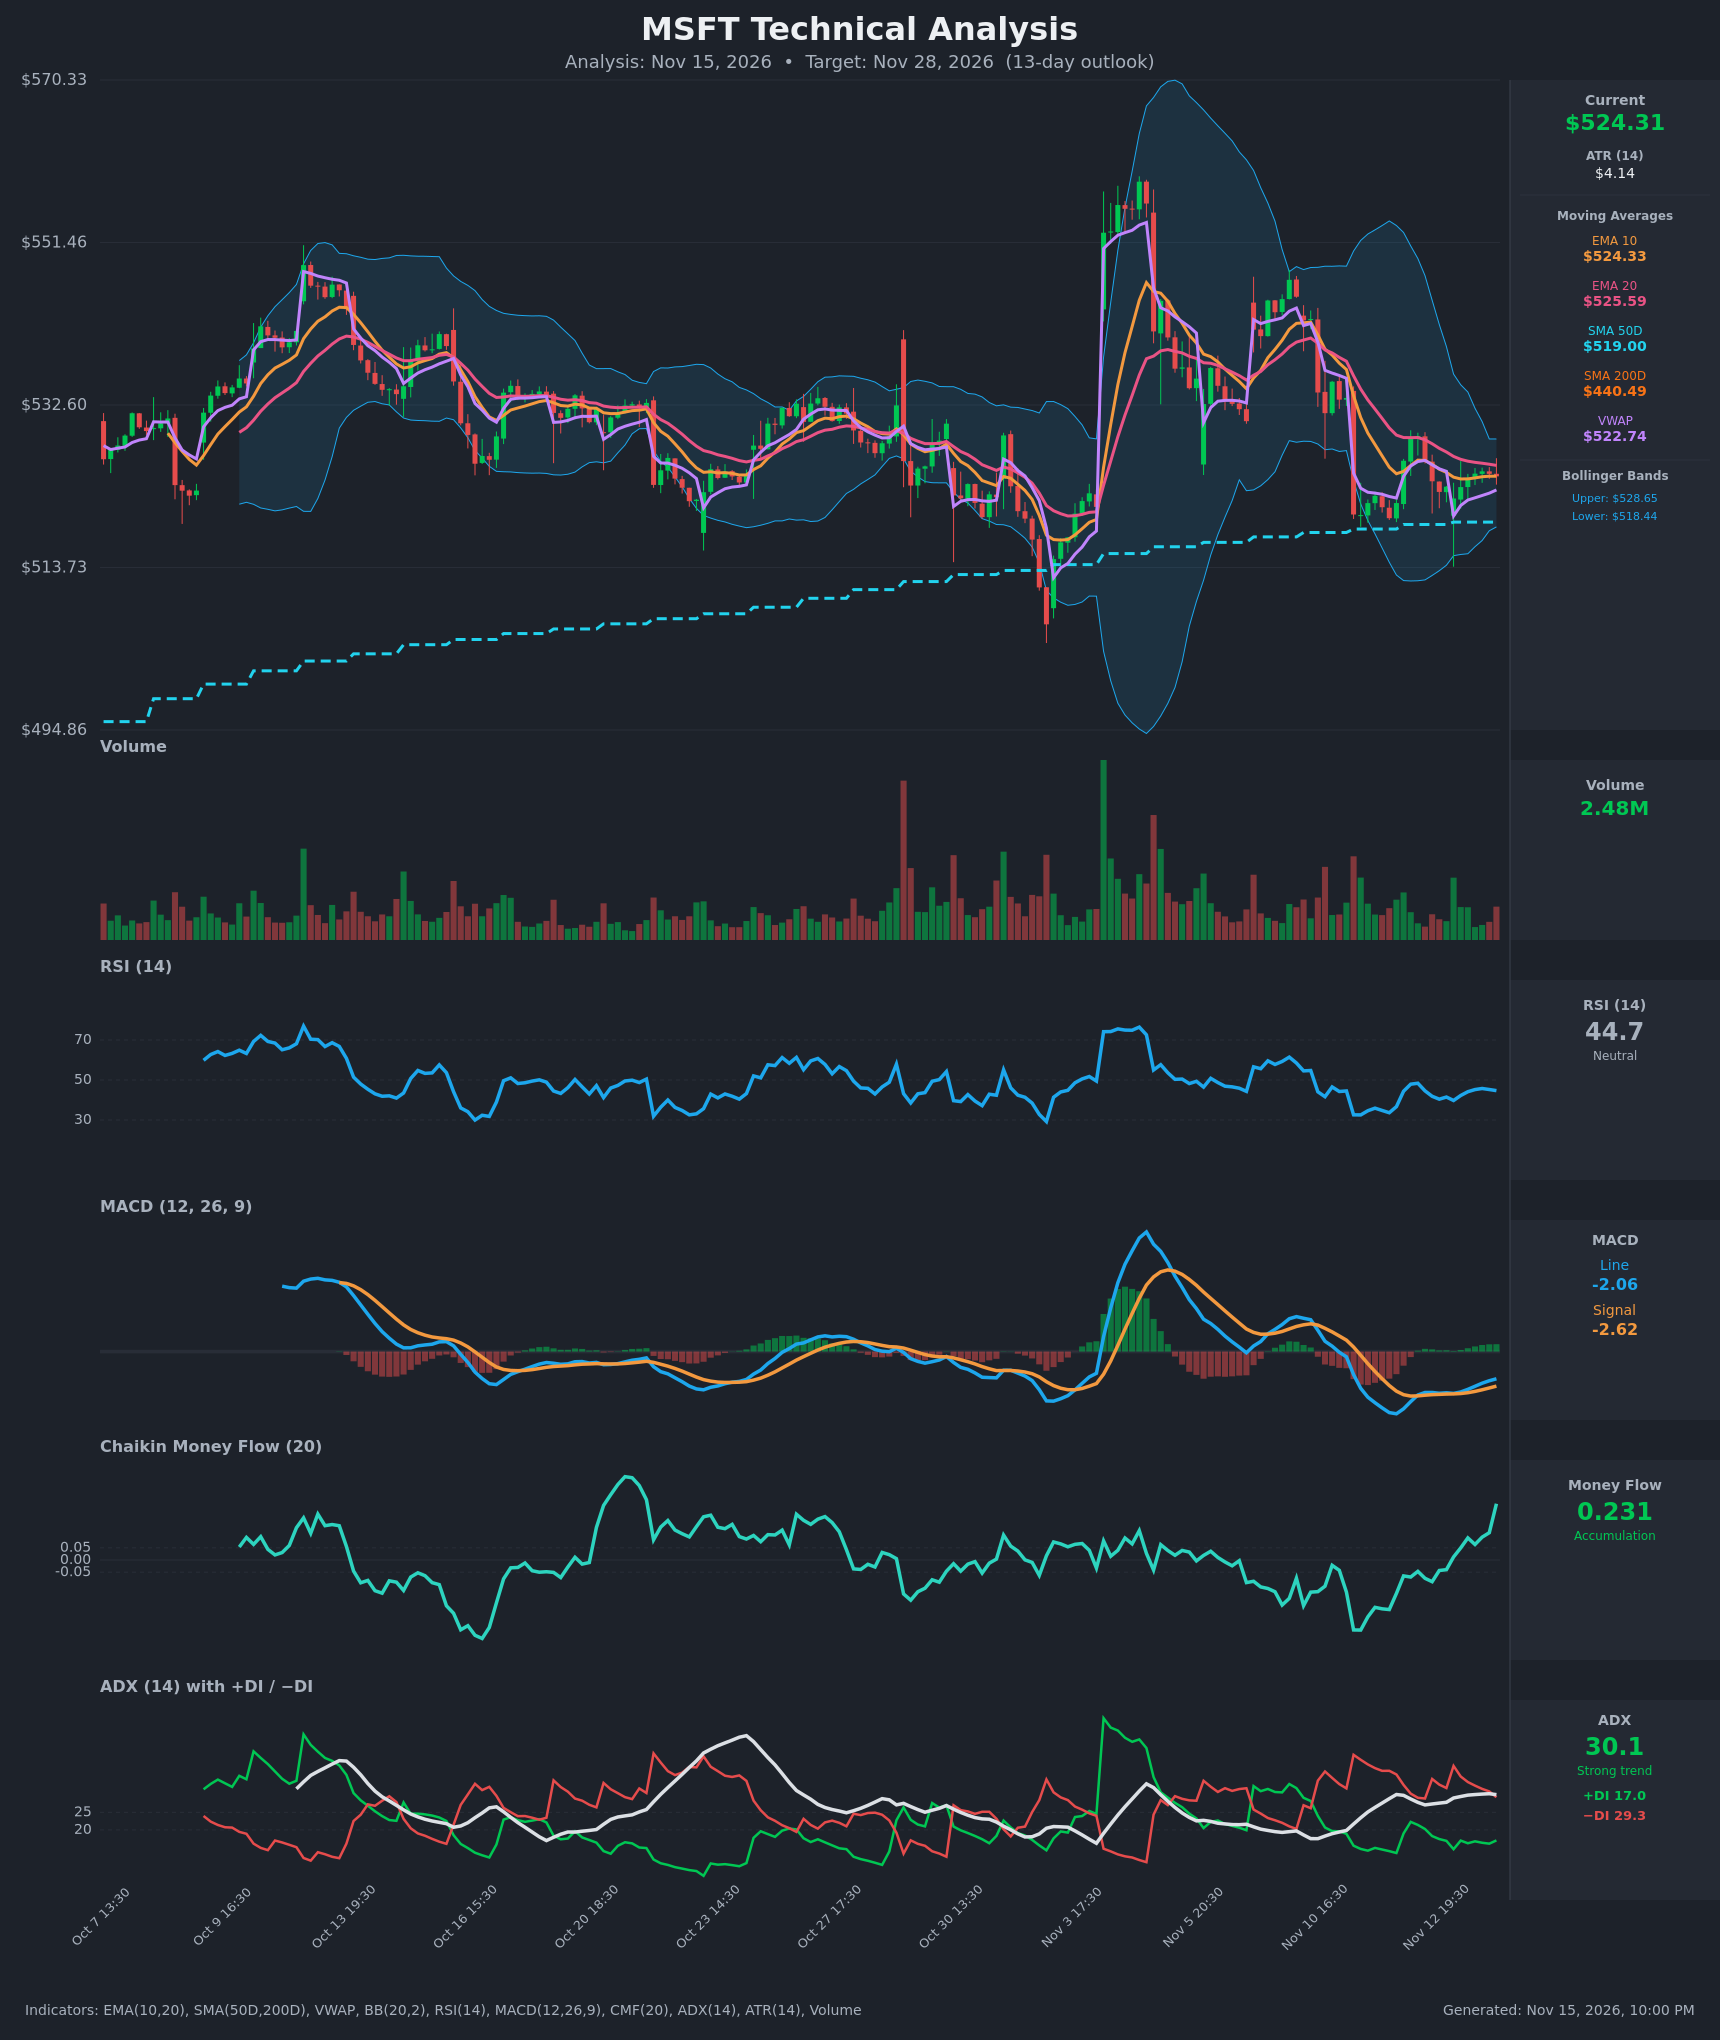
Analysis
TECHNICAL INDICATORS
- RSI (14): 44.68. It is below 50 but well off the 36.7 low on Nov 11, and it has been rising or flat for the last few sessions. Momentum is recovering from weak levels without being overbought or oversold. [Neutral]
- 20 EMA: $525.59, with price at $524.31 just below it. EMA10 ($524.33) is flat against price, and EMA10 stays below EMA20, so there is no bullish EMA cross yet. The 20 EMA is acting as near-term resistance, but the gap is only about 0.2%. [Bearish]
- MACD: Line -2.06, signal -2.62, histogram about +0.56. The line crossed above the signal around Nov 13 16:30 and the gap has kept widening. Both lines are still below zero, so this is an early recovery cross rather than a confirmed trend change. [Bullish]
- Bollinger Bands (20): Upper $528.65, lower $518.44, middle about $523.5. Bandwidth has contracted sharply from the early-November expansion, which is a squeeze. Price sits just above the midline, so there is no directional edge until a band breaks. [Neutral]
- CMF (20): 0.231, up from -0.137 on Nov 11 and the highest reading in the recent window. This is strong accumulation, and buying pressure is building even though price is flat. [Accumulation]
- ADX (14): 30.1 with +DI 17.0 and −DI 29.3. The trend is strong and −DI is still on top, which reflects the prior pullback. However, −DI has fallen from 38.2 to 29.3 while +DI has edged up, so the bearish trend is losing force. [Strong Trend, bearish but fading]
- Volume: 2.48M, below the spikes seen on the Nov 3-4 rally and the early-November selloff. The consolidation is on quiet volume, which fits a coiling pattern rather than active distribution. [Neutral/Quiet consolidation]
DIVERGENCES & TRENDS
- Bullish CMF divergence: CMF has surged from -0.14 to +0.23 while price stayed pinned around $521-$529. Money flow is improving ahead of price.
- MACD: The bullish signal-line cross came with a rising histogram, and MACD is turning up from its mid-November low.
- DI trend: −DI is falling and +DI is rising, but there is no DI crossover yet. A +DI/−DI cross would confirm the shift.
- Long-term trend: Price is above SMA50 ($519.00) and far above SMA200 ($440.49). SMA50 is rising and there has been no death cross, so the long-term uptrend is intact.
- VWAP: Price ($524.31) is above VWAP ($522.74), which is mildly supportive.
- Resistance cluster: EMA20 at $525.59 and the upper Bollinger Band at $528.65 are the near-term hurdles.
- Lower highs: The mid-November highs have been lower than the Nov 5-6 highs, which is a minor negative.
CHART PATTERNS
- Symmetrical triangle / pennant-style consolidation: After the swing down from the ~$549 area, price is compressing between falling resistance (~$529) and rising support (~$518-$519, SMA50). The Bollinger squeeze supports this read. Given the prior uptrend above the 200-day, a breakout upward is slightly more likely. The measured move from a break above $529 projects toward roughly $538-$545.
- Bearish variant: If price loses $518 on a close, it would resemble a bearish pennant or descending triangle, with a measured move toward the $505-$510 area.
- The pattern is not clean enough to be decisive, so it supports only modest conviction.
POTENTIAL SCENARIOS
- Scenario 1: Bullish Breakout from Squeeze — Accumulation (CMF 0.23), the MACD cross and a fading −DI support an upside resolution above the EMA20 and upper band. Trigger: close above $529 with a pickup in volume, and a +DI/−DI cross. Target: $538-$545. Invalidation: close below $518. (50% probability)
- Scenario 2: Bearish Breakdown — Persistent −DI dominance and rejection at the EMA20 lead to a break of the SMA50 and lower Bollinger Band. Trigger: close below $518 on rising volume. Target: $505-$510. Invalidation: reclaim of $526 and a MACD move above zero. (28% probability)
- Scenario 3: Neutral Range Chop — Price continues to oscillate between $518 and $529 as the squeeze persists. Trigger: failure to break either band on volume. Target: $520-$528. Invalidation: close outside the $518-$529 range. (22% probability)
PRICE TARGETS
- Target Price: $532.00 (13-day)
- Expected Range: $508.00 to $548.00 (width $40 ≈ 7.6% of current price, in line with the 7-10 to 14-21 day guidance)
- Key Levels: Support at $519.00 (SMA50, lower band at $518.44), Resistance at $528.65 (upper Bollinger Band)
OVERALL BIAS
OVERALL BIAS: BULLISH - Strong CMF accumulation, a fresh bullish MACD cross, fading −DI and price above the rising SMA50 and SMA200 favor an upside break of the current squeeze. Price must still clear the EMA20 and $529 resistance, and a close below $518 would invalidate the call.
This is educational analysis and not financial advice.