NBIS 13-day bearish forecast — Nov 15, 2026
- Bias: Bearish
- Timeframe: 13 days (made Nov 15, 2026, target date Nov 27, 2026)
- Price at analysis: $115.81
- Price target: $109.50
- Expected range: $97.00 – $122.00
- Result: Pending — graded after the close on Nov 27, 2026
Get a free AI analysis of NBIS today
Analysis
TECHNICAL INDICATORS
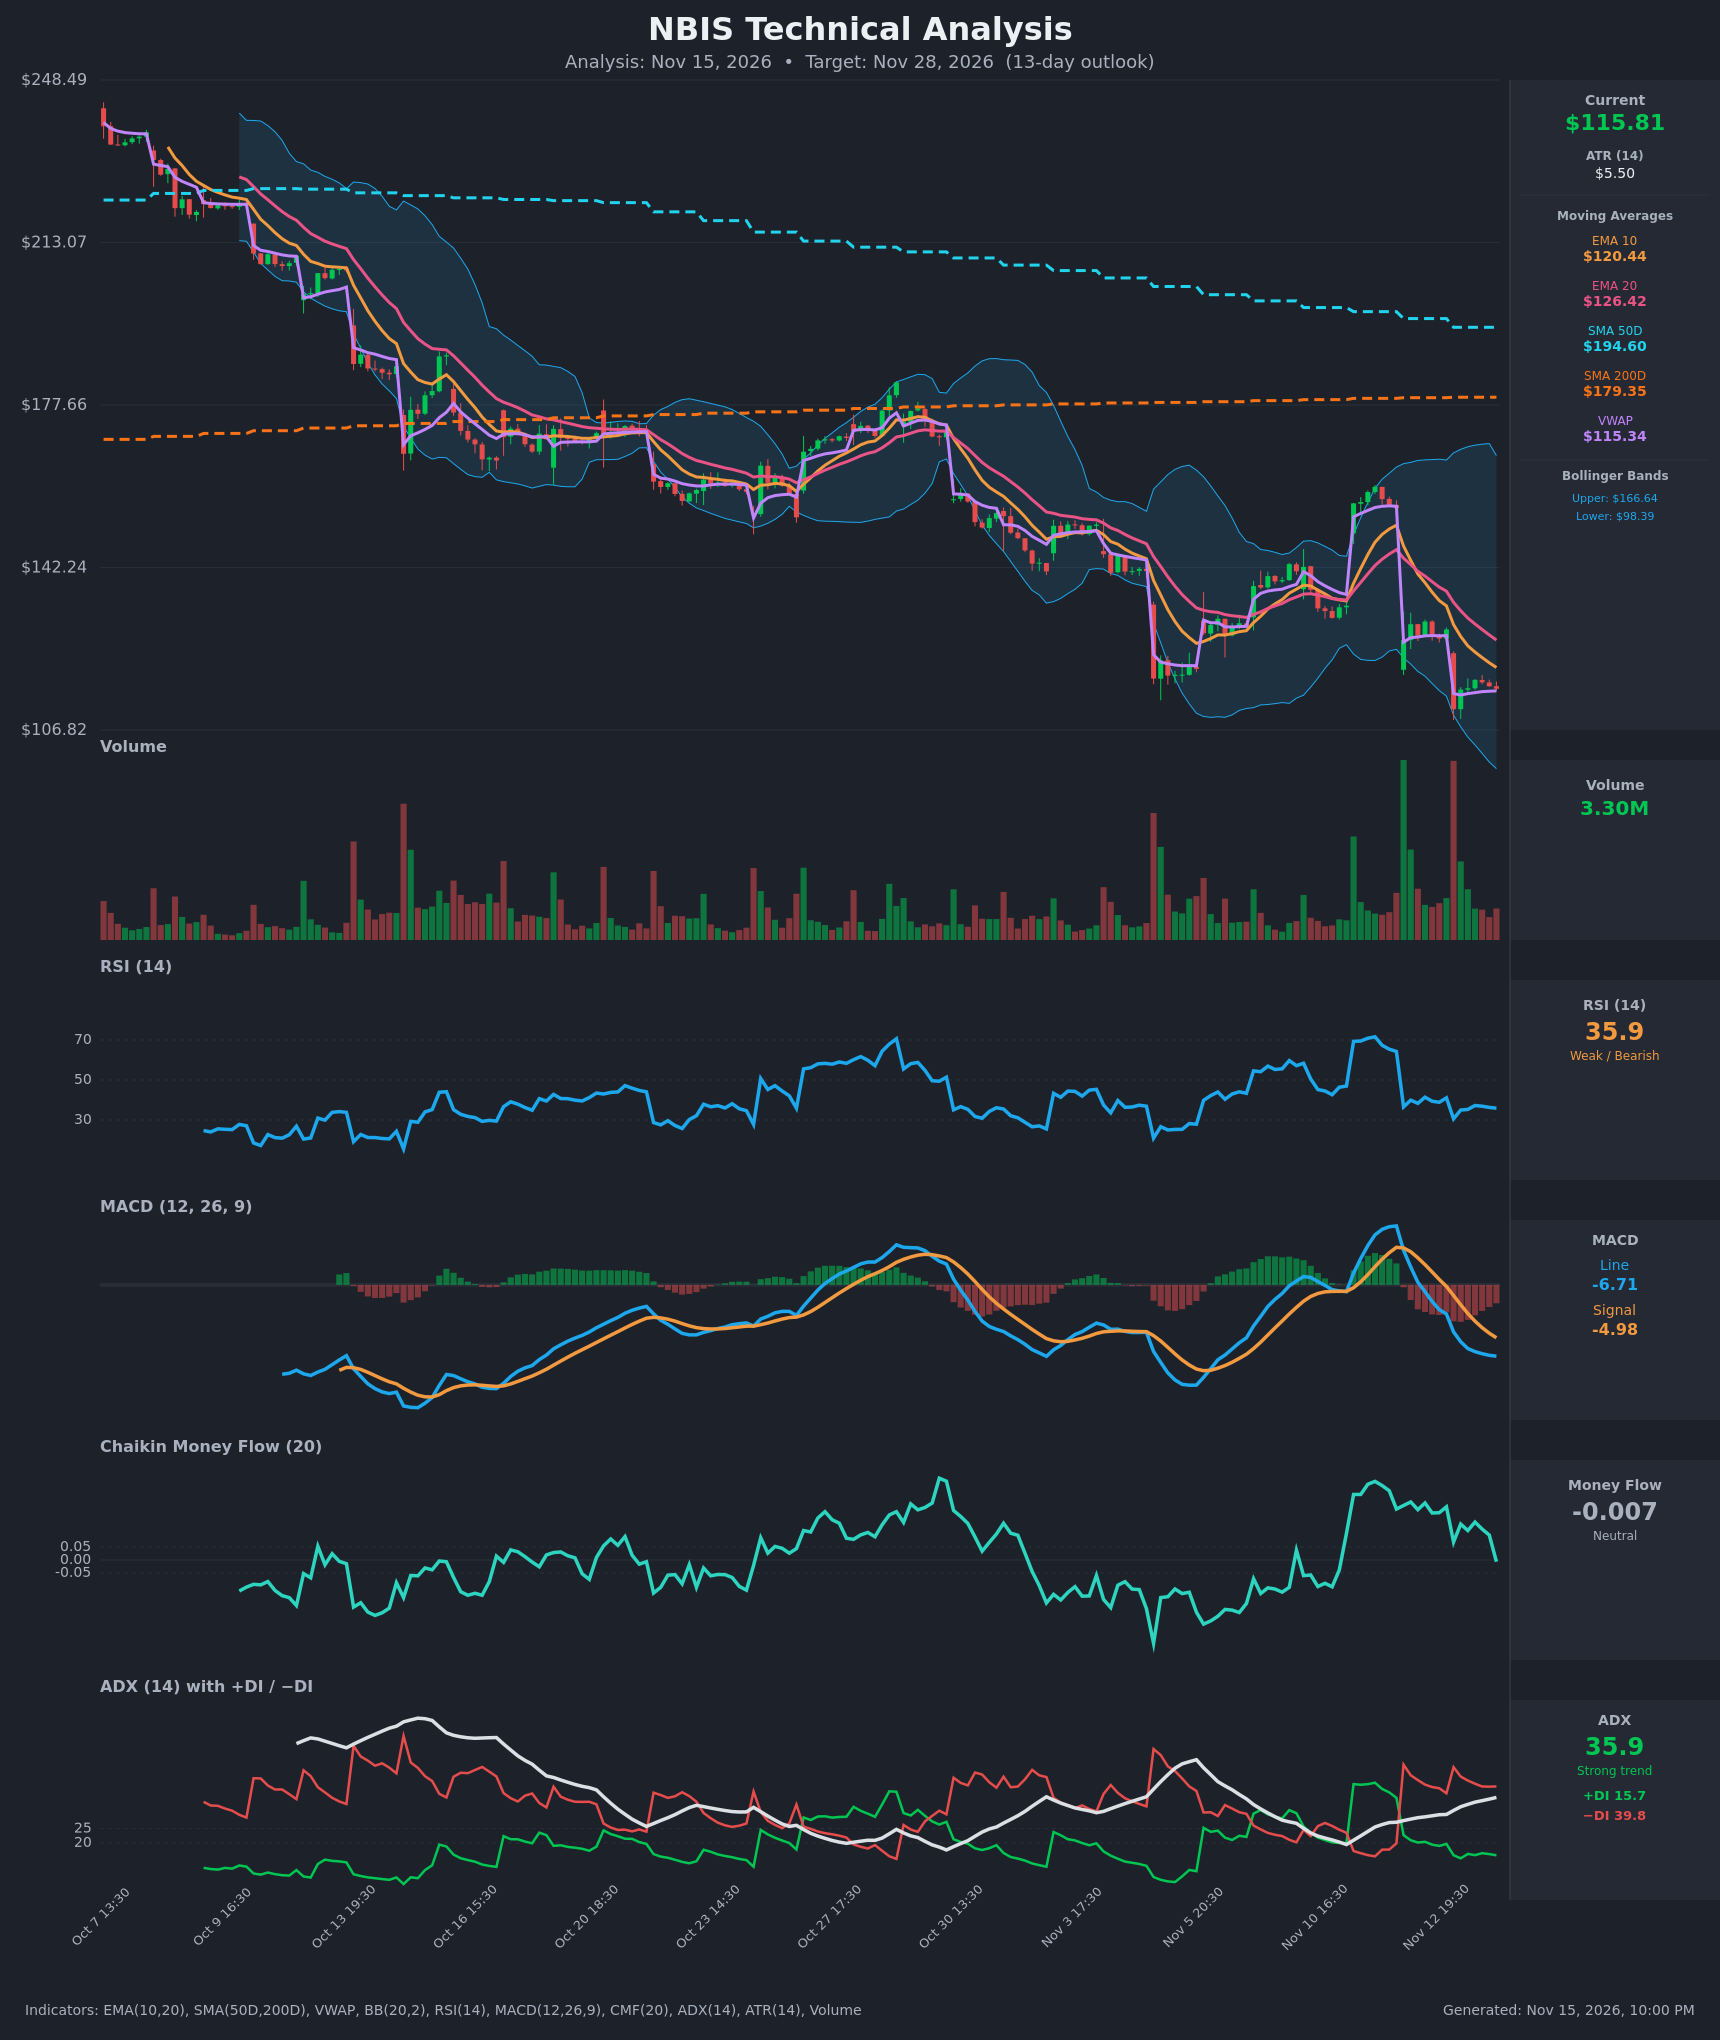
- RSI (14): 35.91, near the oversold threshold but not yet below 30. It has been capped in the 30-41 area since the Nov 12 gap lower, and the Nov 13 low was 30.6. Momentum is weak with no bullish turn yet. [Bearish]
- 20 EMA: $126.42, with price at $115.81 about 8% below it. The EMA10 ($120.44) is below the EMA20 and both are falling steeply, so the EMAs act as overhead resistance. [Bearish]
- MACD: Line -6.71 is below signal -4.98, a gap of about -1.7 that is still widening. The histogram is negative and expanding after the bearish crossover on Nov 12-13. [Bearish]
- Bollinger Bands (20): Upper $166.64, lower $98.39, mid-band roughly $132.5. Price sits in the lower third of the bands. The bands are very wide after a volatile period, so there is room to run lower, but price is not yet at the lower band. [Bearish]
- CMF (20): -0.007, in the neutral zone (±0.05). It has dropped from +0.2 over the last two sessions, so money flow is deteriorating and now turning toward distribution. [Neutral]
- ADX (14): 35.9 and rising, with -DI at 39.8 far above +DI at 15.7. This is a strong, established downtrend with bears firmly in control. [Strong Trend - Bearish]
- Volume: 3.30M on the latest bar, light compared with the huge spikes on the Nov 12 and Nov 13 gap-down sessions. The latest bar shows no capitulation or reversal volume, only quiet drifting near the lows. [Bearish - no capitulation yet]
DIVERGENCES & TRENDS
- There is no bullish RSI divergence. RSI made a similar low (~30) as price made new lows, so momentum is confirming the decline.
- The death cross is already in place: SMA50D ($194.60) is far below... actually above SMA200D ($179.35) but both are being left behind. Price is about 35% below the SMA50D and 35% below the SMA200D, which confirms a long-term downtrend. The SMA50D is still above the SMA200D, so a death cross is a risk if the decline persists.
- The EMA10 crossed below the EMA20 well before this period, and the gap has widened. MACD crossed bearish on Nov 12.
- Price is trading just above VWAP ($115.34), which marks a short-term pivot. A loss of VWAP would extend the selling.
- ADX has risen from about 27 to 36 while -DI dominates, so the trend is strengthening, not exhausting.
- CMF is fading from +0.2 to about 0, an early warning that buyers are stepping away.
CHART PATTERNS
- The broader structure is a sequence of lower highs and lower lows from ~$248 down to ~$115. It resembles a Bearish Pennant / Bearish Flag continuation. Price bounced to ~$130 after the Nov 12 gap and is now pressing lower, which implies continuation.
- The ~$111 low (Nov 13) has been tested twice and may be a short-term floor. A close below it would project a measured move toward $100 or lower, near the lower Bollinger Band ($98.39).
- There is no confirmed reversal pattern (no double bottom or falling wedge breakout) yet.
- ATR of $5.50 implies a typical 13-day move of about ±$20 (ATR × √13 ≈ $19.8), consistent with the high volatility regime.
POTENTIAL SCENARIOS
- Scenario 1: Bearish Trend Continuation — Price stays below the falling EMA10/EMA20 and breaks the $111 low, with MACD and -DI dominance sustaining the downtrend. Trigger: close below $111 and VWAP ($115.34). Target: $103 initially, then $98-100 (lower Bollinger Band). Invalidation: close above $126.4 (EMA20). (55% probability)
- Scenario 2: Neutral Base and Chop — Price consolidates between the $108-111 support and the $122-126 EMA resistance as RSI stabilises near 30-40. Trigger: holds $111 with low volume. Target: $112-$122 range. Invalidation: break below $108 or above $127. (15% probability)
- Scenario 3: Bullish Oversold Bounce — RSI near 30 prompts a relief rally toward the EMAs. Trigger: reclaim of $120.4 (EMA10) on rising volume. Target: $126-$132 (EMA20 / mid-band). Invalidation: failure at the EMA20 or a close back below $111. (30% probability)
PRICE TARGETS
- Target Price: $109.50 (13-day)
- Expected Range: $97.00 to $122.00 (width $25, about 21.6% of current price; this is wide because of the high-volatility regime, with ATR of $5.50)
- Key Levels: Support at $111.00, Resistance at $120.44
OVERALL BIAS
OVERALL BIAS: BEARISH - ADX of 35.9 with -DI (39.8) far above +DI (15.7), a bearish MACD crossover with a widening gap, and price below all key moving averages point to continued downside. Price is likely to test the $98-$103 zone, although an oversold RSI near 30 leaves room for a relief bounce toward $120-126.
This is educational analysis and not financial advice.