NOK 13-day bearish forecast — Nov 15, 2026
- Bias: Bearish
- Timeframe: 13 days (made Nov 15, 2026, target date Nov 27, 2026)
- Price at analysis: $8.07
- Price target: $7.85
- Expected range: $7.60 – $8.50
- Result: Pending — graded after the close on Nov 27, 2026
Get a free AI analysis of NOK today
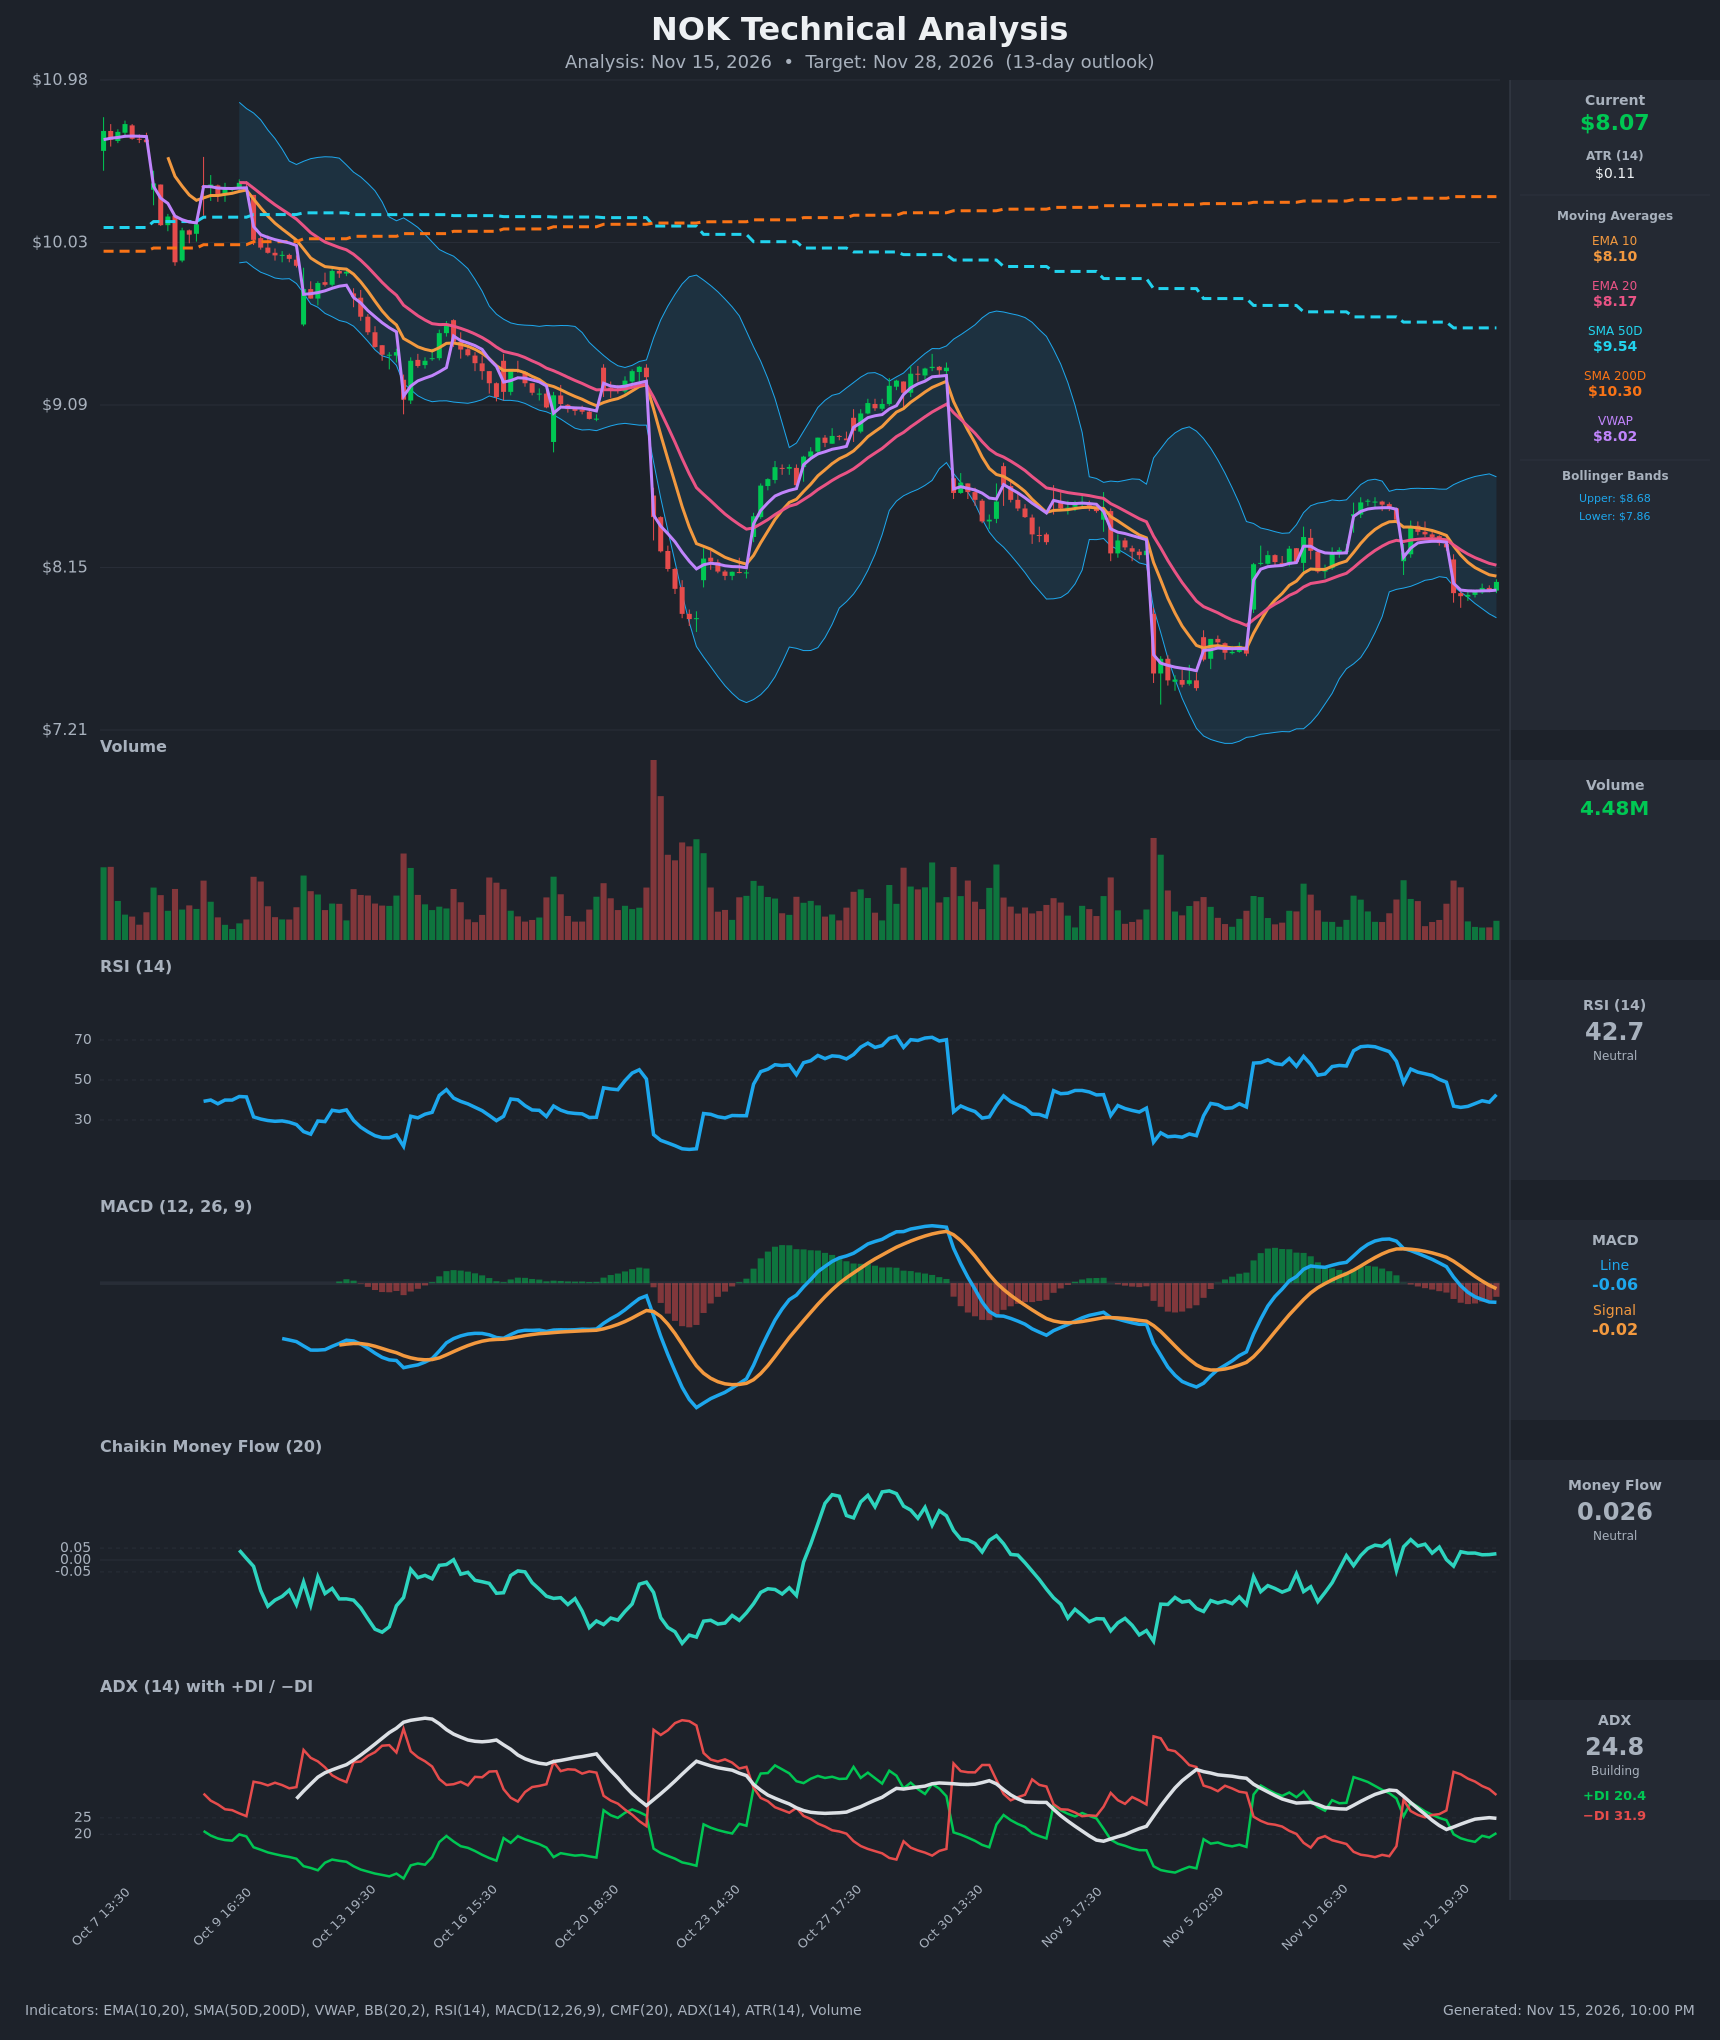
Analysis
TECHNICAL INDICATORS
- RSI (14): 42.67, bouncing from about 36 after the Nov 13 gap down. It is below the 50 midline but not oversold, and the short-term recovery is a bounce within a weak structure. [Bearish]
- 20 EMA: $8.167, with price at $8.07 below it. EMA10 ($8.10) is also below EMA20 and both are sloping down, so the EMAs act as overhead resistance. EMA10 crossed below EMA20 on Nov 13. [Bearish]
- MACD: Line -0.056 is below signal -0.016, and the bearish crossover happened on Nov 13. The histogram is negative and widening, so downside momentum is building. [Bearish]
- Bollinger Bands (20): Upper $8.68, lower $7.86, midline about $8.27. Price is in the lower half, about 25% of the band width above the lower band, with no squeeze or breakout. The lower band at $7.86 is nearby support, and the Nov 5-6 low near $7.5 is the major floor. [Bearish]
- CMF (20): 0.026 is between ±0.05, so money flow is neutral. It has been mildly positive for several bars despite falling price, which is a minor sign of absorption. [Neutral]
- ADX (14): 24.8 with −DI 31.9 above +DI 20.4. That is a near-strong trend, and the bears are clearly in control. ADX has been flat to slightly rising, and −DI has dominated since Nov 12. [Moderate Trend, Bearish]
- Volume: 4.48M, which is below average on the latest bars. The gap down came on elevated volume, while the current bounce is on light volume, so it lacks conviction. [Weak bounce, Bearish lean]
Price ($8.07) is also below VWAP only marginally (VWAP $8.0225, so price is slightly above it), and well below SMA50 ($9.54) and SMA200 ($10.30). The death cross is already in place, and the long-term trend is firmly down.
DIVERGENCES & TRENDS
- Price made a lower low area near $7.5 on Nov 5-6, then a lower high near $8.5 on Nov 10-11. The sequence of lower highs since October continues.
- MACD peaked below its October high, which confirms weakening upside momentum on each rally.
- CMF is slightly positive while price is near its lows. This is a minor bullish divergence, but at 0.026 it is not strong enough to override the other signals.
- The EMA10/EMA20 bearish cross and the MACD bearish cross both occurred on Nov 13. The −DI/+DI gap is wide at 11.5 points.
- Price is holding just above VWAP ($8.02), which is the immediate pivot.
- The 50-day SMA is falling steeply toward price, and the 200-day SMA is flat to lower. Both remain far above and are not a near-term factor.
CHART PATTERNS
- Primary: a descending channel of lower highs and lower lows since October, resembling a bearish continuation structure (descending triangle / bearish flag type). The Nov 5-6 low near $7.50 acts as a horizontal base, with lower highs near $8.5-9.4 pressing down on it. This resembles a Descending Triangle, which usually resolves lower.
- The bounce from $7.5 to $8.5 and the pullback to $8.0 looks like a bearish flag or pause after the gap down. A break below $7.86 (the lower Bollinger Band) would target the $7.50 base, and a break below that would project toward about $7.0.
- A bullish invalidation would be a close above the EMA20/mid-band zone at $8.27-$8.35, followed by a move above the $8.50 swing high.
POTENTIAL SCENARIOS
- Scenario 1: Bearish Continuation Lower — −DI dominance, a negative MACD and the lower-high structure point to a retest of the lower band and then the prior low. Trigger: a close below $7.95-$7.86 on rising volume. Target: $7.60, then $7.50. Invalidation: a daily close above $8.35. (50% probability)
- Scenario 2: Neutral Range-Bound Chop — Price consolidates between the lower Bollinger Band and the EMAs as CMF stays neutral and ADX stays below 25. Trigger: failed breaks of either $7.86 or $8.30. Target: $7.90-$8.30. Invalidation: a close outside that range. (28% probability)
- Scenario 3: Bullish Relief Bounce — Oversold conditions on the lower timeframe and the slightly positive CMF fuel a squeeze back toward the mid-band and the previous high. Trigger: a close above $8.27-$8.35 with volume. Target: $8.50-$8.68. Invalidation: a drop back below $8.00. (22% probability)
PRICE TARGETS
For a 13-day timeframe, the expected range width should be about 8-12% of price, or roughly $0.65-$0.95. I use a range of $7.60 to $8.50, which is $0.90 wide, or about 11.2% of $8.07, within the guidance.
- Target Price: $7.85 (13-day, below the current price, consistent with a bearish bias)
- Expected Range: $7.60 to $8.50
- Key Levels: Support at $7.86 (lower Bollinger Band; then $7.50), Resistance at $8.17 (EMA20; then $8.68 upper band)
OVERALL BIAS
OVERALL BIAS: BEARISH - Price is below all key moving averages with a confirmed death cross, a fresh bearish MACD cross, −DI well above +DI, and a bounce on light volume. The structure of lower highs and a retest of the $7.50 base is the most likely path within 13 days, though neutral CMF and a nearby lower band limit conviction.
This is educational analysis and not financial advice.