NFLX 13-day bearish forecast — Nov 15, 2026
- Bias: Bearish
- Timeframe: 13 days (made Nov 15, 2026, target date Nov 27, 2026)
- Price at analysis: $62.15
- Price target: $60.90
- Expected range: $58.50 – $64.50
- Result: Pending — graded after the close on Nov 27, 2026
Get a free AI analysis of NFLX today
Analysis
TECHNICAL INDICATORS
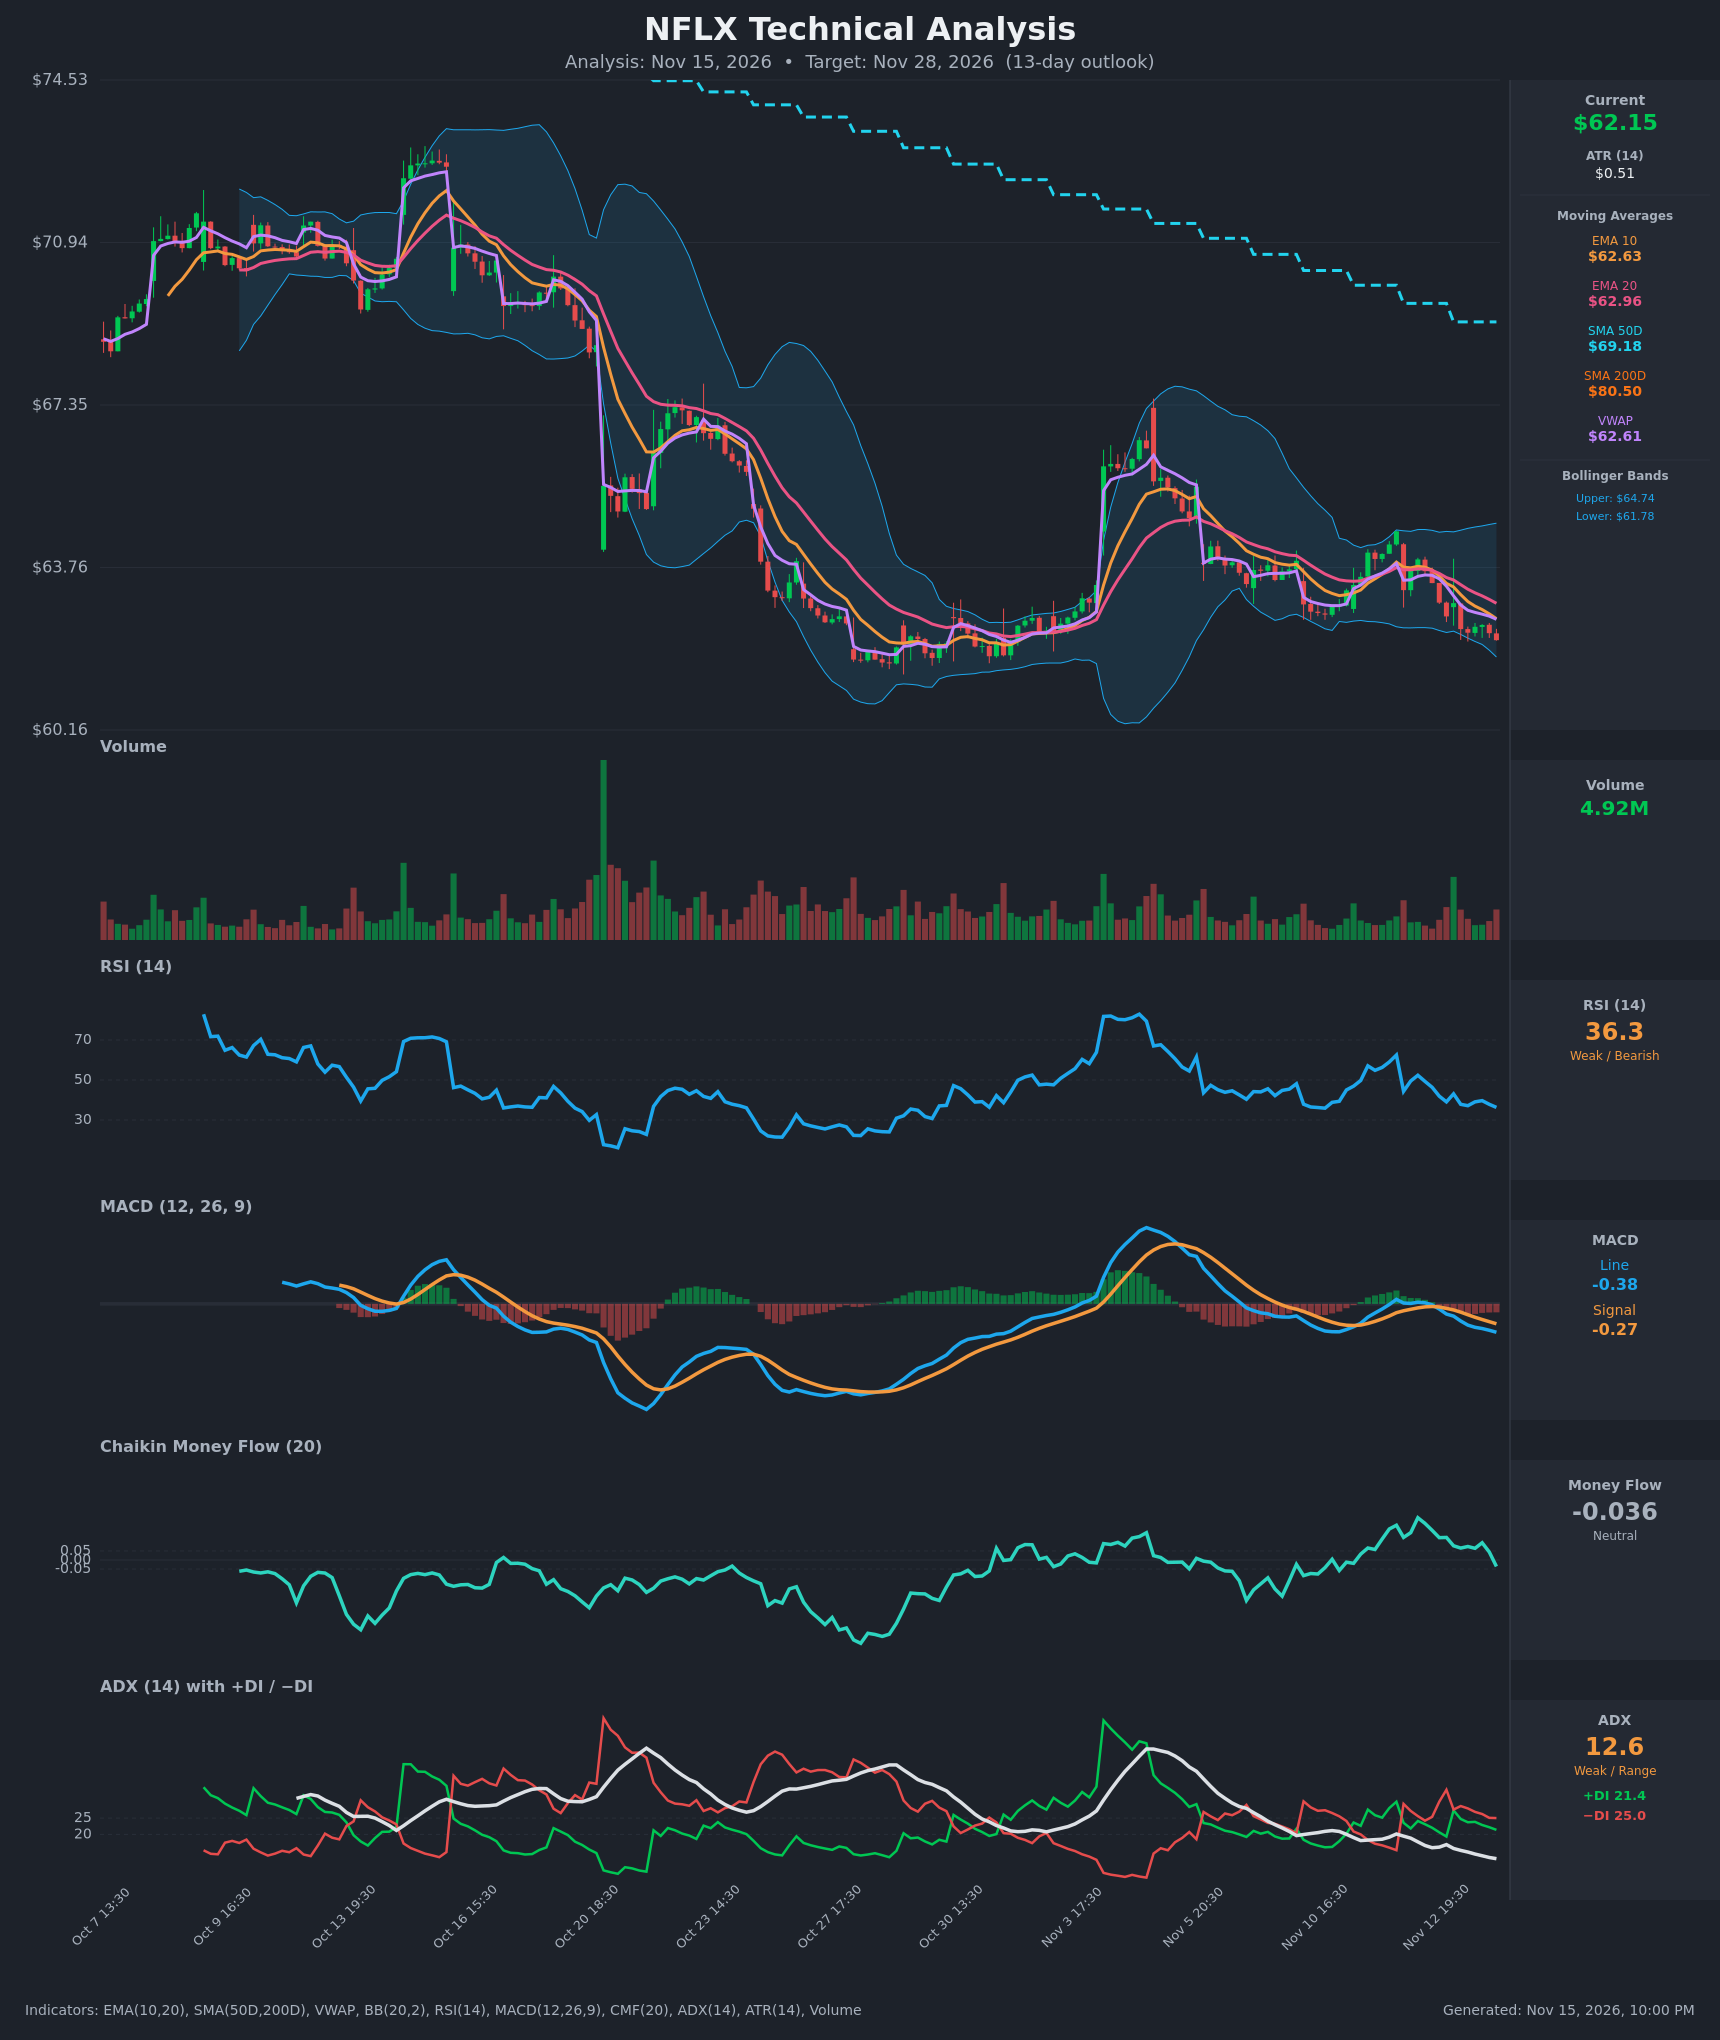
- RSI (14): 36.29, near the oversold threshold but not there yet. It has fallen from 52 on Nov 12 and is making lower lows within the recent range. Momentum is weak but not yet washed out. [Bearish]
- 20 EMA: $62.96, with price at $62.15 below it. EMA10 ($62.63) is below EMA20, so the short-term cross is bearish and the 20 EMA acts as overhead resistance. [Bearish]
- MACD: Line -0.382 is below signal -0.268, with a bearish crossover on Nov 12. The histogram is negative and widening (-0.114), so downside momentum is still building. [Bearish]
- Bollinger Bands (20): Upper $64.74, lower $61.78, so price is in the lower quarter of the bands and about $0.37 above the lower band. The bands are narrow, which points to compressed volatility. A lower-band walk is possible, but the bands show no extreme stretch. [Bearish]
- CMF (20): -0.036 is in the neutral zone (±0.05). It has dropped from +0.23 to slightly negative, so buying pressure is fading and flow is starting to tilt toward distribution. [Neutral]
- ADX (14): 12.6 and falling, so there is no real trend. −DI (25.0) is above +DI (21.4), a slight bearish tilt, but the spread is small. [Weak Trend, bearish lean]
- Volume: 4.92M, unremarkable and without a capitulation spike. Recent red bars are not heavy, so selling is orderly. A volume surge would be needed to confirm a breakdown or a reversal. [Neutral]
Other context:
- VWAP: $62.61, with price below it. [Bearish]
- SMA50D / SMA200D: $69.18 / $80.50. Price is far below both, and SMA50 is below SMA200, which is a death-cross structure. The long-term trend is firmly down.
DIVERGENCES & TRENDS
- No clear bullish RSI divergence yet. RSI is making lower lows alongside price, and the RSI low from the Oct 20 selloff area (about 25) was far deeper, so current momentum is only moderately weak.
- MACD has turned down after the early-November spike (the gap-up to ~$67). The line is falling below the signal and heading toward zero-line weakness.
- The price trend is a series of lower highs. The Nov 3-4 bounce to ~$67 failed and fully retraced, and each rally has been sold. All EMAs are stacked bearishly: price < EMA10 < EMA20 < SMA50 < SMA200.
- ADX has collapsed from the 30s to 12.6, so the market is in a low-trend drift. Price is grinding along the lower Bollinger Band with a slight downward slope.
- CMF has rolled over from strongly positive (+0.23) to slightly negative, which confirms fading demand.
- Price is sitting just above the $61.5-62 zone, which was the late-October base and is the key support.
CHART PATTERNS
- Bearish Flag / Pennant (continuation): The Nov 4 spike is followed by a decline and then tight, low-range sideways action around $62-64. This resembles a bearish pennant or small flag within the broader downtrend. A break below ~$61.80 would project roughly $2-3 lower (the flag-pole height is large, but a conservative measured move is ~$59-60).
- Potential Double Bottom (reversal), watch only: The late-October low (~$61.5) and the current price are close in level. This would become bullish only on a hold of $61.5 and a break above ~$64.5-65 (the neckline/upper band). It is not confirmed.
- The broader structure is a downtrend with a descending channel, and the longer-term pattern is bearish.
POTENTIAL SCENARIOS
- Scenario 1: Bearish Breakdown of Base — Price loses the lower Bollinger Band and the $61.50 late-October support, which resolves the bearish pennant. Momentum (MACD, RSI, −DI) supports the move. Trigger: close below $61.50 on rising volume. Target: $59.50-$60.00. Invalidation: reclaim of $63.00 (EMA20). (45% probability)
- Scenario 2: Neutral Range Grind — Price stays between $61.50 and $63.50 with low ADX, bouncing off the lower band, then fading at the EMAs. Trigger: RSI turns up from the mid-30s without a break of $61.50. Target: $62.00-$63.00. Invalidation: close outside $61.30-$64.00. (30% probability)
- Scenario 3: Bullish Mean-Reversion Bounce — An oversold bounce toward the upper band, helped by price being near prior support and RSI approaching 30. Trigger: close above $63.00 (EMA20) and then $63.70. Target: $64.50-$65.00. Invalidation: close below $61.50. (25% probability)
PRICE TARGETS
For a 13-day horizon, the range width should be about 8-12% of price. Check: range $58.50 to $64.50 = $6.00 wide, or 9.7% of $62.15, which is within the guidance.
- Target Price: $60.90 (13-day)
- Expected Range: $58.50 to $64.50
- Key Levels: Support at $61.50, Resistance at $62.96
OVERALL BIAS
OVERALL BIAS: BEARISH - Price is below every moving average and VWAP, MACD has crossed bearish with a widening negative histogram, −DI is above +DI, and the structure of lower highs resembles a bearish pennant just above support. The weak ADX and the near-oversold RSI temper conviction, but the weight of evidence favors a drift lower toward ~$61.
This is educational analysis and not financial advice.