NVDA 13-day bullish forecast — Nov 15, 2026
- Bias: Bullish
- Timeframe: 13 days (made Nov 15, 2026, target date Nov 27, 2026)
- Price at analysis: $162.82
- Price target: $166.00
- Expected range: $158.50 – $173.50
- Result: Pending — graded after the close on Nov 27, 2026
Get a free AI analysis of NVDA today
Analysis
TECHNICAL INDICATORS
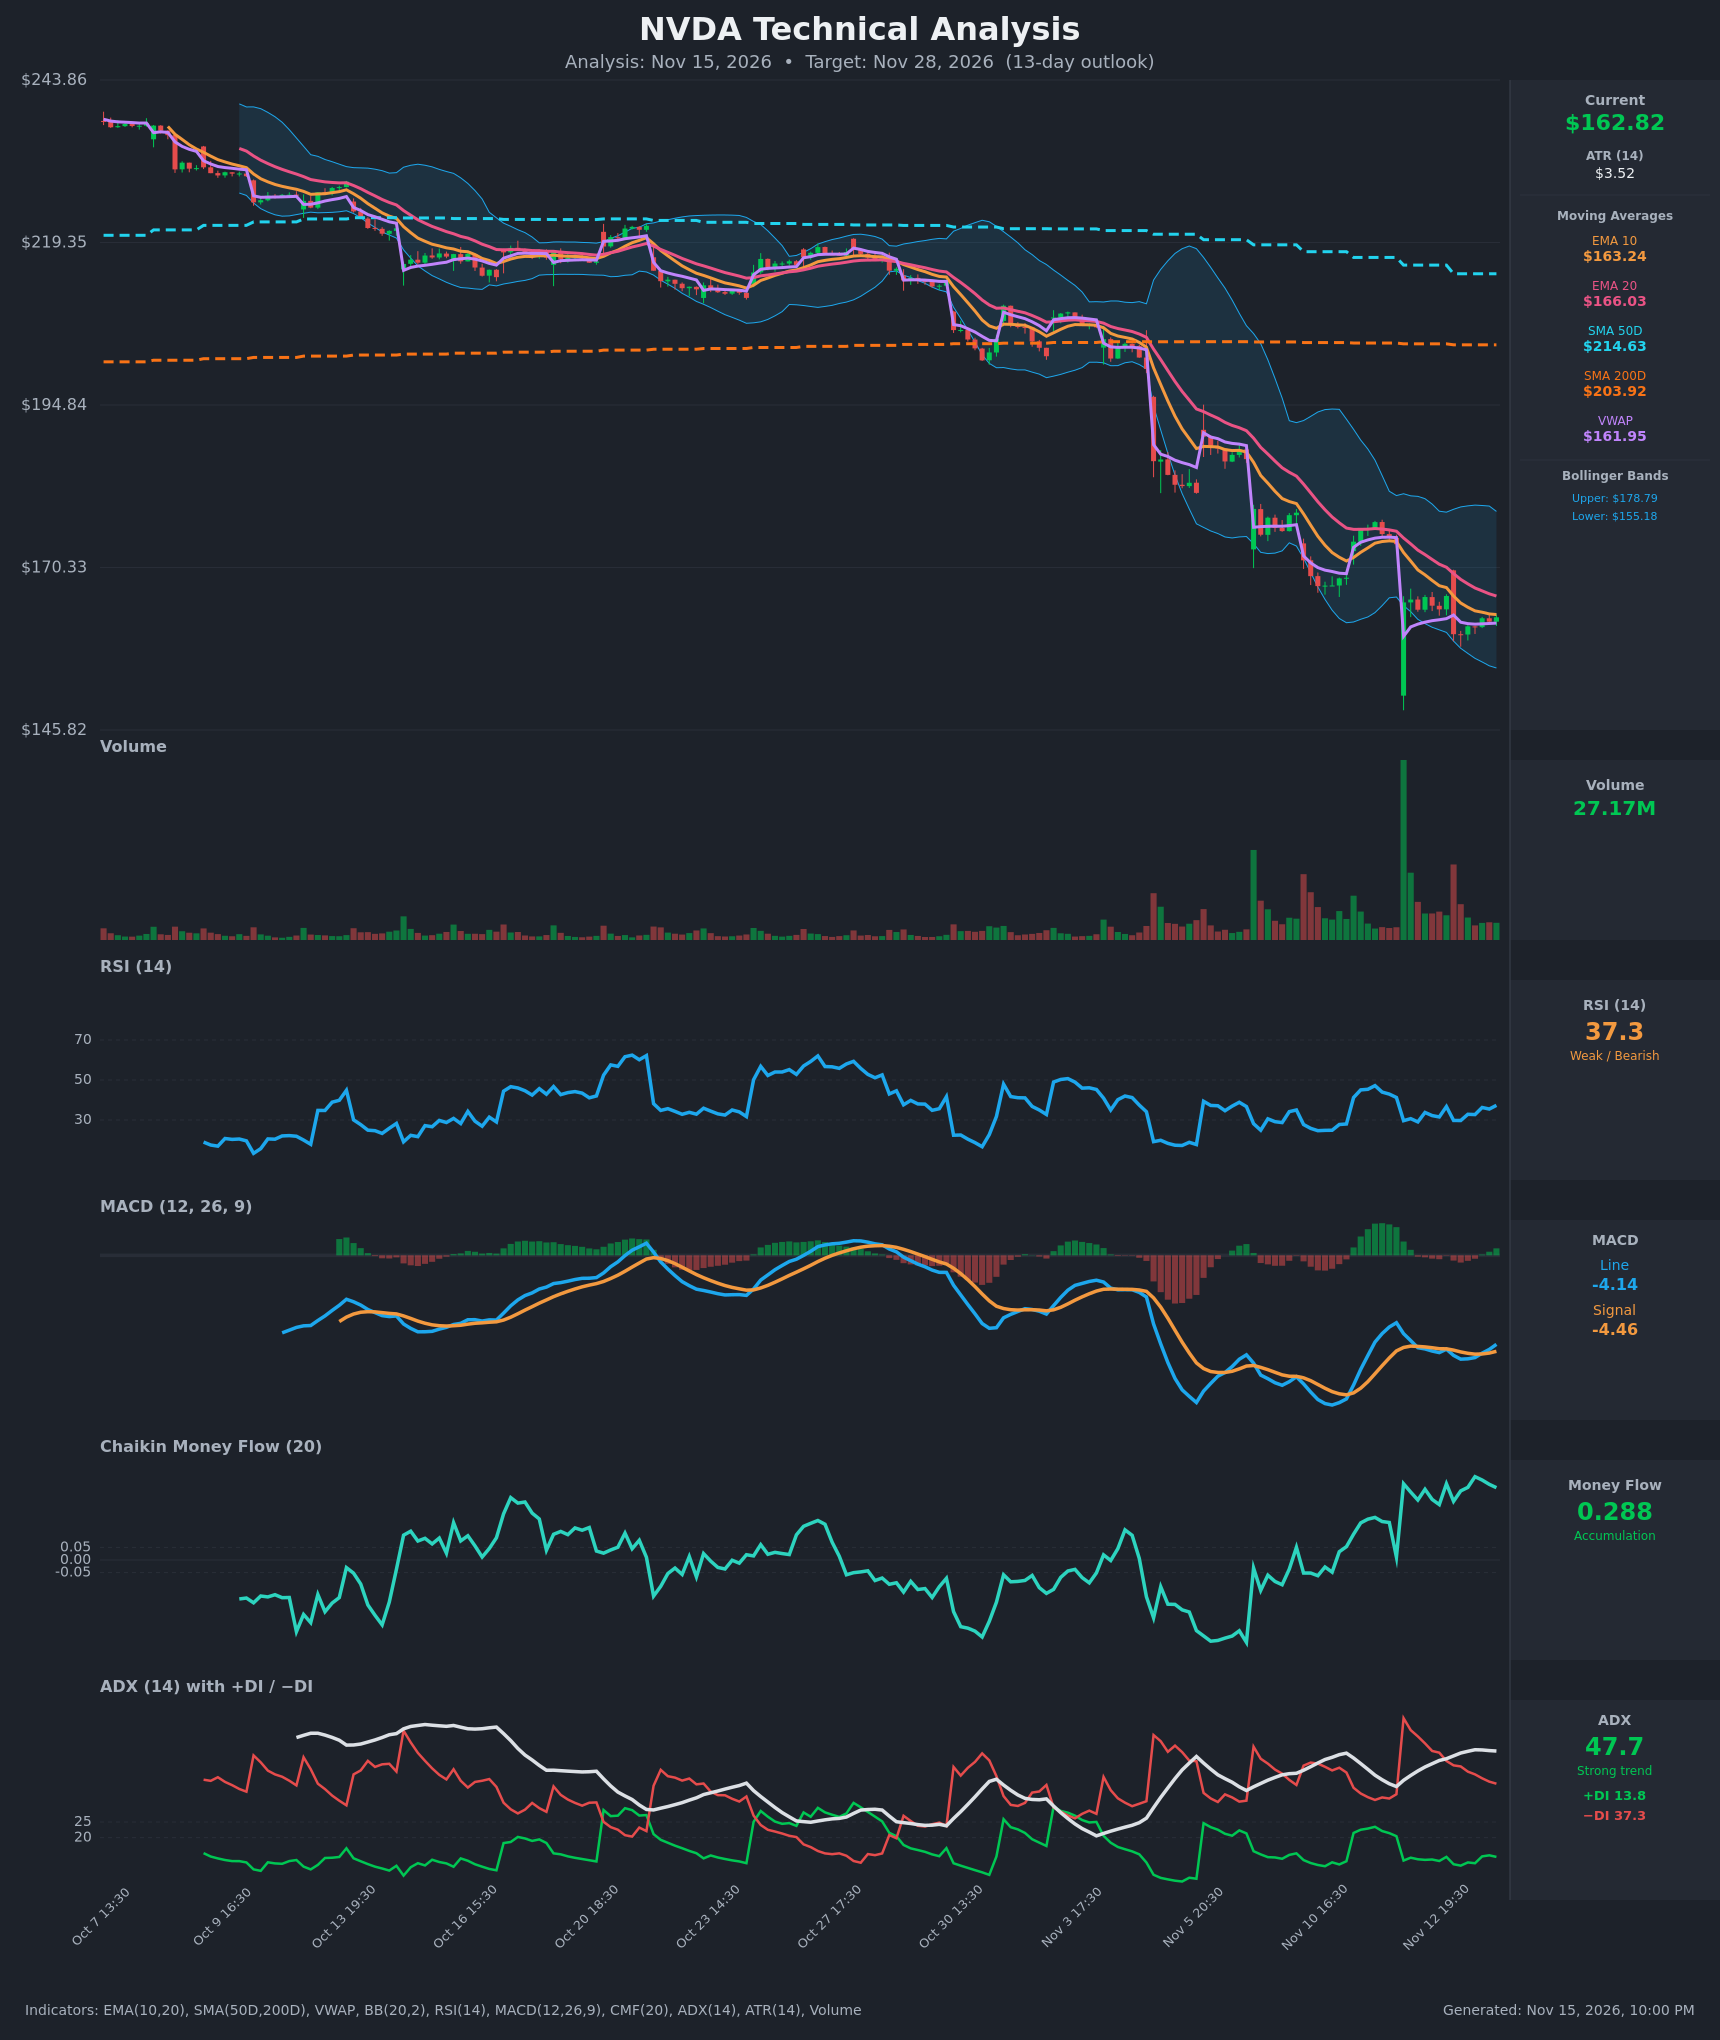
- RSI (14): 37.33, up from 29-30 at the Nov 12-13 lows but still below 50. The oversold reading has eased and momentum is stabilizing. Price made a lower low (~$160.24) while RSI roughly matched its prior low, a mild bullish divergence. [Neutral]
- 20 EMA: $166.03, with EMA10 at $163.24. Price ($162.82) sits below both, and EMA10 is under EMA20 with both sloping down. The 20 EMA is overhead resistance, about 2% above price. [Bearish]
- MACD: Line -4.137 is above Signal -4.461 after crossing up on the last bars, so the histogram has turned slightly positive. Both lines are still deep below zero, so this is an early, low-level momentum recovery rather than a trend change. [Bullish]
- Bollinger Bands (20): Upper $178.79, lower $155.18, midline ~$166.99. Price is in the lower half (%B ≈ 0.32) after tagging or piercing the lower band during the capitulation spike. Bands are wide but flattening, which suggests volatility is cooling. A bounce toward the midline is plausible, while a band-walk lower would confirm the trend. [Neutral]
- CMF (20): 0.288, strongly positive and near the top of its recent range. It has risen sharply while price fell, which points to buying on the capitulation flush. [Accumulation]
- ADX (14): 47.7 with −DI 37.3 above +DI 13.8. This is a very strong downtrend, but ADX has plateaued (48.2 → 47.7) and −DI has fallen from 58 to 37. That suggests the selling pressure is peaking. [Strong Trend – Bearish]
- Volume: 27.17M, far below the huge capitulation spike on Nov 12 and fading on the last bars. Heavy-volume selling followed by drying volume often signals exhaustion, but the move has not yet been confirmed by a volume-backed rally. [Selling Exhaustion / Neutral]
DIVERGENCES & TRENDS
- Trend: Price is in a persistent downtrend from ~$243 to ~$163. It is well below SMA200 ($203.92) and SMA50 ($214.63), and every bounce has made lower highs. The SMA50 is still above the SMA200 but the gap is narrowing, so a death cross is a risk in coming weeks.
- CMF divergence: CMF has risen to +0.29 while price made new lows, a bullish divergence.
- RSI divergence: There is a mild bullish divergence, with RSI holding near 30 on a lower price low.
- MACD: The MACD line crossed above its signal line (−4.137 vs −4.461) while still deeply negative. This is a bullish crossover, but it is weak below zero.
- DI lines: −DI is falling from its 58 peak while +DI is flat near 13.8, so there is no bullish DI crossover yet.
- VWAP: Price ($162.82) is just above VWAP ($161.95), a small positive.
- Bounce resistance: EMA10 ($163.24), EMA20 ($166.03) and the BB midline (~$167) form a resistance cluster overhead.
CHART PATTERNS
- Post-capitulation base: After a gap-down flush with a long lower wick and a volume spike, price has coiled in a tight $160-$166 range. This resembles a Bullish Falling Wedge or a base inside a larger downtrend. A breakout above ~$166-$167 would target about $172-$178 (the upper Bollinger Band area).
- Bearish Pennant risk: The same tight consolidation after a sharp drop could also be read as a Bearish Pennant/Flag. A break below ~$160 would imply a measured move toward ~$150-$155 (the lower BB and capitulation low).
- Big picture: The larger structure is a persistent lower-high, lower-low channel. It is bearish until price reclaims the 20 EMA and then ~$175.
POTENTIAL SCENARIOS
- Scenario 1: Bullish Relief Bounce to the Mean — Capitulation volume, CMF accumulation and the MACD cross support a reflex rally toward the EMA20/BB midline, with a possible extension to the upper $160s or low $170s. Trigger: a close above $166.03 (EMA20) with rising volume. Target: $166-$173. Invalidation: a close below $160.24. (48% probability)
- Scenario 2: Bearish Trend Continuation — The strong ADX downtrend with −DI dominance resumes. Price fails at the EMA10/EMA20 cluster and breaks the base, retesting the capitulation zone. Trigger: a break below $160.24 on rising volume. Target: $152-$155 (lower BB, then the spike low near $148-$150). Invalidation: a close above $167. (37% probability)
- Scenario 3: Neutral Chop in the Base — Price stays in the $159-$167 range as selling exhausts but buyers lack follow-through. Trigger: low-volume overlap with the EMAs. Target: $160-$166. Invalidation: a close beyond either edge of the range. (15% probability)
PRICE TARGETS
- Target Price: $166.00 (13-day)
- Expected Range: $158.50 to $173.50 (width $15.00 ≈ 9.2% of the current price, consistent with a 13-day horizon)
- Key Levels: Support at $160.24, Resistance at $166.03
OVERALL BIAS
OVERALL BIAS: BULLISH - The evidence is mixed, but a capitulation flush on heavy volume, strongly positive CMF (+0.29), a MACD bullish crossover, RSI recovering from ~30, and a plateauing ADX with falling −DI favor a modest relief bounce toward the 20 EMA/BB midline. Conviction is limited because price is below all major moving averages and the trend is still strongly down. A break below $160.24 would flip the bias bearish.
This is educational analysis and not financial advice.