ORCL 13-day bearish forecast — Nov 15, 2026
- Bias: Bearish
- Timeframe: 13 days (made Nov 15, 2026, target date Nov 27, 2026)
- Price at analysis: $125.37
- Price target: $122.80
- Expected range: $118.50 – $128.50
- Result: Pending — graded after the close on Nov 27, 2026
Get a free AI analysis of ORCL today
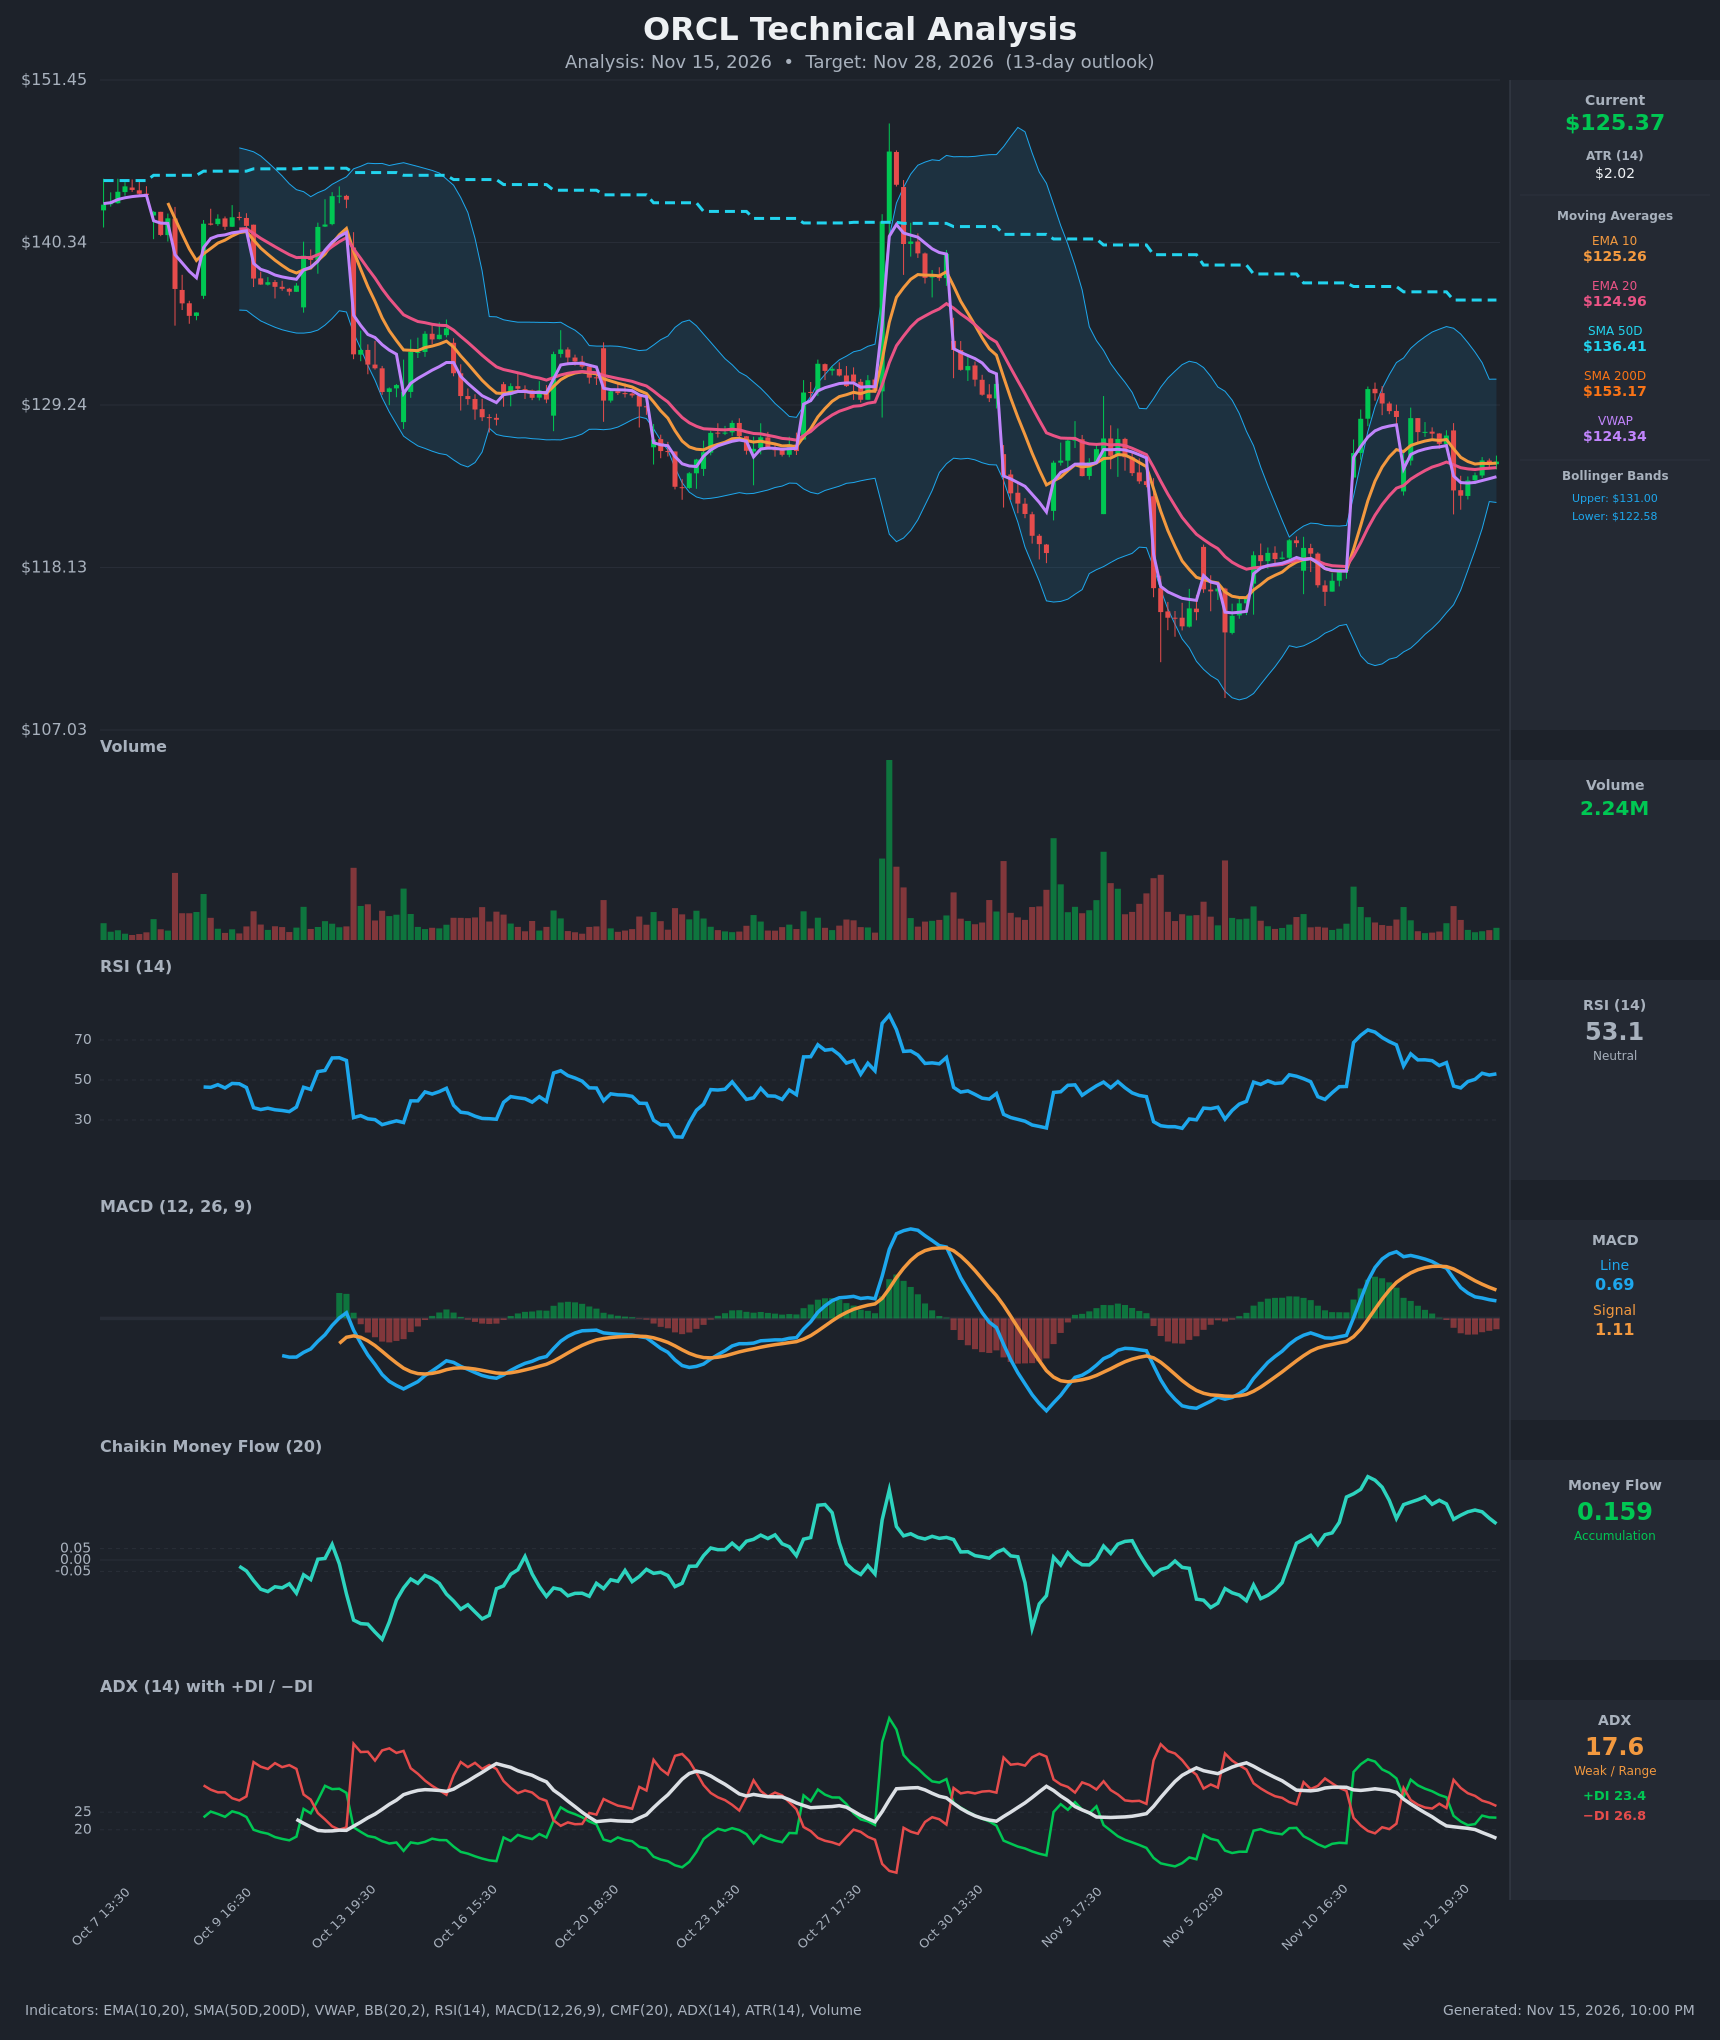
Analysis
TECHNICAL INDICATORS
- RSI (14): 53.06, mid-range. It has eased from 67.6 on Nov 11 to a low of 46 on Nov 13, then recovered to 53. There is no overbought or oversold condition, and momentum is flat to slightly improving. [Neutral]
- 20 EMA: $124.96. Price ($125.37) is just above it, and EMA10 ($125.26) is also barely above EMA20. The 10/20 EMAs are converging and flat, so support is thin. [Neutral]
- MACD: The line (0.688) is below the signal (1.113), a bearish crossover that occurred around Nov 13. The histogram is about -0.43 and has been narrowing for three bars from -0.64, a sign of fading downside momentum. The line is still falling toward zero. [Bearish]
- Bollinger Bands (20): Upper $131.00, lower $122.58, midline about $126.79. Price sits in the lower half of the bands, below the midline. The bands are moderately narrowing after the earlier expansion, which points to consolidation. Neither band is being tested. [Neutral]
- CMF (20): +0.159, above the +0.05 threshold. It has been positive for the full 15-bar window (0.16–0.28) but is fading from its 0.276 peak. Buying pressure persists but is weakening. [Accumulation]
- ADX (14): 17.6 and falling (from 30.6), so the trend is weak. −DI (26.8) is above +DI (23.4), a mild bearish tilt after the +DI/−DI bearish cross on Nov 12–13. [Weak Trend, Bearish lean]
- Volume: 2.24M, below the spikes seen on the Oct 28 surge and the Nov 5–6 selloff. Recent volume is muted, so the consolidation lacks conviction either way. [Neutral, low participation]
Other trend context:
- Price is below SMA50 ($136.41) and SMA200 ($153.17), and SMA50 is well below SMA200 (death-cross configuration). That is a long-term downtrend.
- Price is above VWAP ($124.34), a small intraday positive.
DIVERGENCES & TRENDS
- CMF vs price: CMF stays elevated and positive while price has stalled and made lower closes on Nov 13. This is mild bullish divergence, but CMF is rolling over from its peak.
- MACD: The bearish signal-line cross is not yet reversed, but the narrowing histogram suggests selling pressure is abating.
- ADX/DI: ADX has dropped from over 30 to 17.6 as the Nov 10–11 rally faded. DI lines flipped to −DI on top, which is a weak bearish tilt within a range.
- Price structure: The chart shows lower highs since the Oct 28 spike (about $148 → $135 → $131 → $129). A higher low formed after the Nov 5–6 bottom near $112. The long-term structure is bearish, while the short-term structure is a recovery that has stalled.
- Moving averages: EMA10 and EMA20 are compressing and price is hugging them. There is no decisive crossover, which fits a coiling move.
CHART PATTERNS
- Bullish Flag / Pennant (continuation): After the sharp Nov 10–11 advance from about $118 to $129, price has consolidated between roughly $123 and $128.50. A break above $128.50 would target about $133–134.
- Descending channel / lower highs (bearish continuation): On the larger timeframe, price is trapped below the declining SMA50 and SMA200. Rallies have been sold at progressively lower highs. A failure here would aim at the lower Bollinger Band and the $118–120 area.
- The flag is a smaller-scale pattern inside a larger downtrend, so it carries less weight. The higher-timeframe trend and the −DI dominance give the bearish side a slight edge, with modest conviction.
POTENTIAL SCENARIOS
- Scenario 1: Bearish Failed Bounce and Drift Lower — Price fails to hold the EMA20 and VWAP, and the weak MACD and −DI dominance pull it toward the lower Bollinger Band. The larger downtrend below SMA50 and SMA200 reasserts. Trigger: close below $124.30 (VWAP and EMA20 zone), then below $122.58. Target: $120.50–$122.50, with an extension to about $118.50. Invalidation: close above $128.50. (45% probability)
- Scenario 2: Bullish Flag Breakout — CMF accumulation and the narrowing MACD histogram lead to a MACD re-cross and a push through the Bollinger midline and recent highs. Trigger: close above $128.50 on rising volume. Target: $131.00 (upper band), then about $133–134. Invalidation: close below $122.50. (33% probability)
- Scenario 3: Neutral Range-Bound Chop — With ADX below 20, price oscillates between $122.50 and $128.50, ending near the EMAs. Trigger: failure to break either side with volume staying low. Target: $124–$127. Invalidation: a decisive close outside the $122–$129 range. (22% probability)
PRICE TARGETS
- Target Price: $122.80 (13-day horizon)
- Expected Range: $118.50 to $128.50. The width is $10.00, or about 8.0% of the current price, which fits the 13-day horizon (wider than a 2–3 day range and in line with the 7–21 day guidance).
- Key Levels: Support at $122.58 (lower Bollinger Band), Resistance at $129.00 (prior swing highs, just above the Nov 12 intraday highs)
OVERALL BIAS
OVERALL BIAS: BEARISH - Price remains in a long-term downtrend below both SMA50 and SMA200. MACD sits below its signal line, and −DI is above +DI with a weak ADX. CMF accumulation and the narrowing MACD histogram keep the conviction modest, so a bounce to $128–129 is possible before the drift lower.
This is educational analysis and not financial advice.