QBTS 13-day bearish forecast — Nov 15, 2026
- Bias: Bearish
- Timeframe: 13 days (made Nov 15, 2026, target date Nov 27, 2026)
- Price at analysis: $9.55
- Price target: $9.15
- Expected range: $8.60 – $9.95
- Result: Pending — graded after the close on Nov 27, 2026
Get a free AI analysis of QBTS today
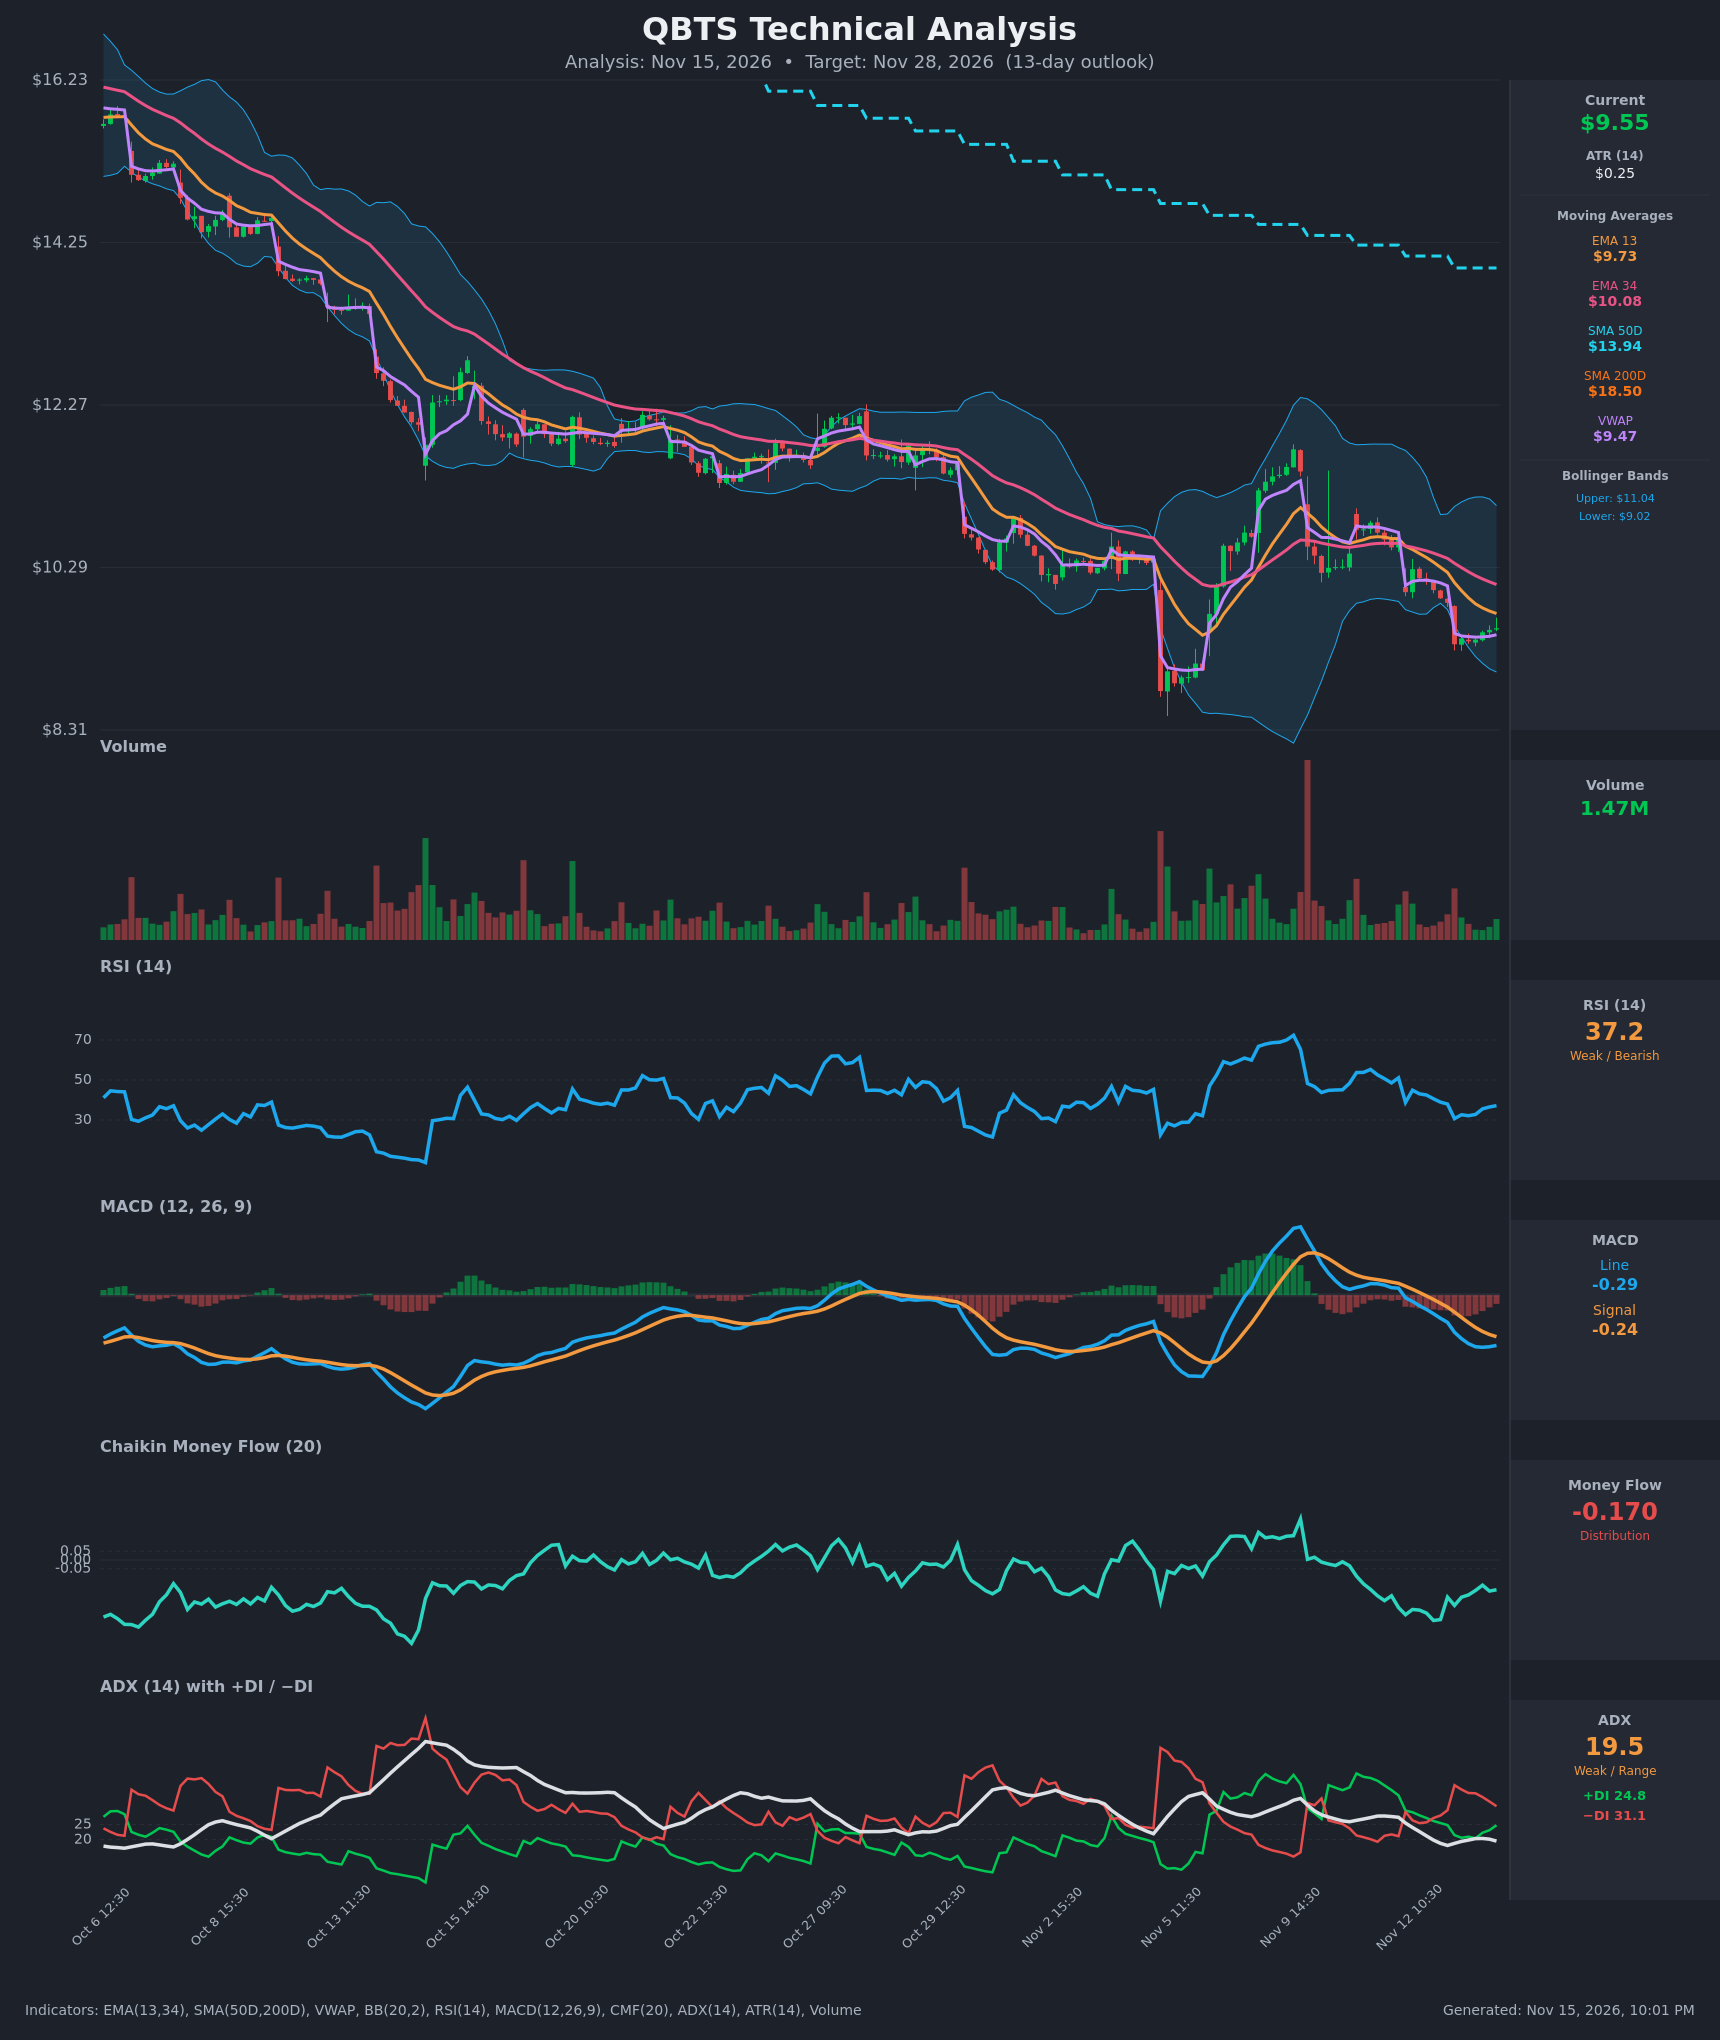
Analysis
TECHNICAL INDICATORS
- RSI (14): 37.18, sitting in the weak/bearish zone but not oversold. It bounced from 30.7 on Nov 13 open but is still below 50 and capped under the Nov 11 reading of ~51. Momentum is a modest recovery inside a downtrend. [Bearish]
- EMA (13/34): Price of $9.55 is below EMA 13 ($9.73) and EMA 34 ($10.08), and EMA 13 is below EMA 34, a bearish stack. Both EMAs are sloping down and act as overhead resistance. Price is also far below the SMA50D ($13.94) and SMA200D ($18.50), and the 50D remains under the 200D (death-cross regime). [Bearish]
- MACD: Line -0.287 is below Signal -0.237, so the histogram is negative at about -0.05. The bearish crossover occurred on Nov 12 and the gap widened until Nov 13 13:30. The line has since ticked up slightly, so the histogram is narrowing, an early sign of selling momentum fading. [Bearish]
- Bollinger Bands (20): Upper $11.04, lower $9.02, midline roughly $10.03. Price is in the lower third, about $0.53 above the lower band. It has not broken below it, so there is no clear oversold extreme. Bands are wide after the volatile Nov 5-11 swing. A walk along the lower band favors continued weakness. [Bearish]
- CMF (20): -0.170, well below -0.05, which shows sustained distribution. It has been negative since about Nov 11 and has improved only slightly from -0.31. Sellers still dominate volume flow. [Distribution]
- ADX (14): 19.5 with -DI 31.1 above +DI 24.8. ADX is below 20, so trend strength is weak, but the DI spread favors bears, who have held control since Nov 13. The market is drifting lower rather than trending sharply. [Weak Trend, Bearish direction]
- Volume: 1.47M, modest and below the big spikes seen on the Nov 5 and Nov 10 selloff candles. Volume on the recent bounce is light, so the small uptick lacks conviction. Price is slightly above VWAP ($9.47), a minor intraday positive. [Neutral to Bearish]
DIVERGENCES & TRENDS
- No clear bullish divergence. Price is near the Nov 5 low area ($8.3-$9.0 zone) while RSI is far above its earlier lows (~25-28), but price has not yet made a lower low, so this is not a confirmed divergence.
- MACD histogram is narrowing in the last few bars as the line flattens, an early sign of selling exhaustion, but no bullish crossover has occurred.
- The macro trend is firmly down: lower highs from ~$16 to ~$11.5 (Nov 10), with price below all key MAs. The Nov 5-10 rally to ~$11.5 was fully retraced.
- The bearish MACD crossover (Nov 12) and the EMA13 < EMA34 stack confirm downside pressure. The SMA50D declines steadily, and the death-cross regime persists.
- Price is holding just above VWAP ($9.47), a key short-term pivot.
- ADX is below 20 and flattening, so the pace of decline may slow into consolidation.
CHART PATTERNS
- The broader structure is a downtrend with a retracement rally that failed at ~$11.5 (Nov 10), then a lower high and a renewed drop. This resembles a Bearish Flag/Pennant continuation after the sharp November drop. The measured move implies further downside.
- The Nov 5 low (~$8.3-$8.9) and the current low zone (~$9.3) may form a Bullish Double Bottom attempt, but it is unconfirmed. It would need a close above the intermediate peak (~$10.3-$10.5) to validate.
- Implication: bearish continuation is the base case. A retest of the lows near $8.9-$9.0 is plausible, and a break below would target ~$8.3 and lower. Bullish reversal needs a reclaim of EMA 34 (~$10.08).
POTENTIAL SCENARIOS
- Scenario 1: Bearish Continuation Lower — Price stays below the declining EMAs, with distribution (CMF -0.17) and -DI dominance pushing price to retest and break the lower Bollinger Band. Trigger: Rejection at EMA 13 (~$9.73) or VWAP loss, then a close below $9.30. Target: $8.90, then $8.50. Invalidation: Daily close above $10.10 (EMA 34). (50% probability)
- Scenario 2: Neutral Base-Building Range — Price consolidates between the Nov 5 low zone and the EMAs as ADX stays below 20 and RSI hovers 35-45. Trigger: Holding $9.00-$9.10 with low-volume chop. Target: $9.30-$9.90 range. Invalidation: Close below $8.90 or above $10.20. (28% probability)
- Scenario 3: Bullish Relief Bounce — The narrowing MACD histogram and RSI recovery lead to a squeeze back toward the midline and EMA 34. Trigger: Break above $9.75 (EMA 13) with rising volume and CMF improving. Target: $10.30-$10.50 (Bollinger midline). Invalidation: Failure at $10.10 and a drop back below $9.40. (22% probability)
PRICE TARGETS
For the 13-day horizon (to Nov 28, 2026), ATR of $0.25 implies a typical daily move of about 2.6%, so the range is sized to roughly 10-11% of the current price.
- Target Price: $9.15 (bearish drift below current price, consistent with the dominant downside scenario)
- Expected Range: $8.60 to $9.95 (width $1.35, about 14% of price. This is slightly above the 8-12% guide for a 13-day horizon because QBTS is highly volatile, with wide Bollinger Bands.)
- Key Levels: Support at $9.02 (lower Bollinger Band), with deeper support near $8.60. Resistance at $9.73 (EMA 13), then $10.08 (EMA 34).
OVERALL BIAS
OVERALL BIAS: BEARISH - Price is below all key moving averages with a bearish EMA stack, a bearish MACD crossover, persistent distribution (CMF -0.17) and -DI above +DI. Weak ADX and a narrowing MACD histogram argue for a slow grind rather than a collapse, so conviction is moderate.
This is educational analysis and not financial advice.