PLTR 13-day bullish forecast — Nov 15, 2026
- Bias: Bullish
- Timeframe: 13 days (made Nov 15, 2026, target date Nov 27, 2026)
- Price at analysis: $167.98
- Price target: $171.50
- Expected range: $162.00 – $177.00
- Result: Pending — graded after the close on Nov 27, 2026
Get a free AI analysis of PLTR today
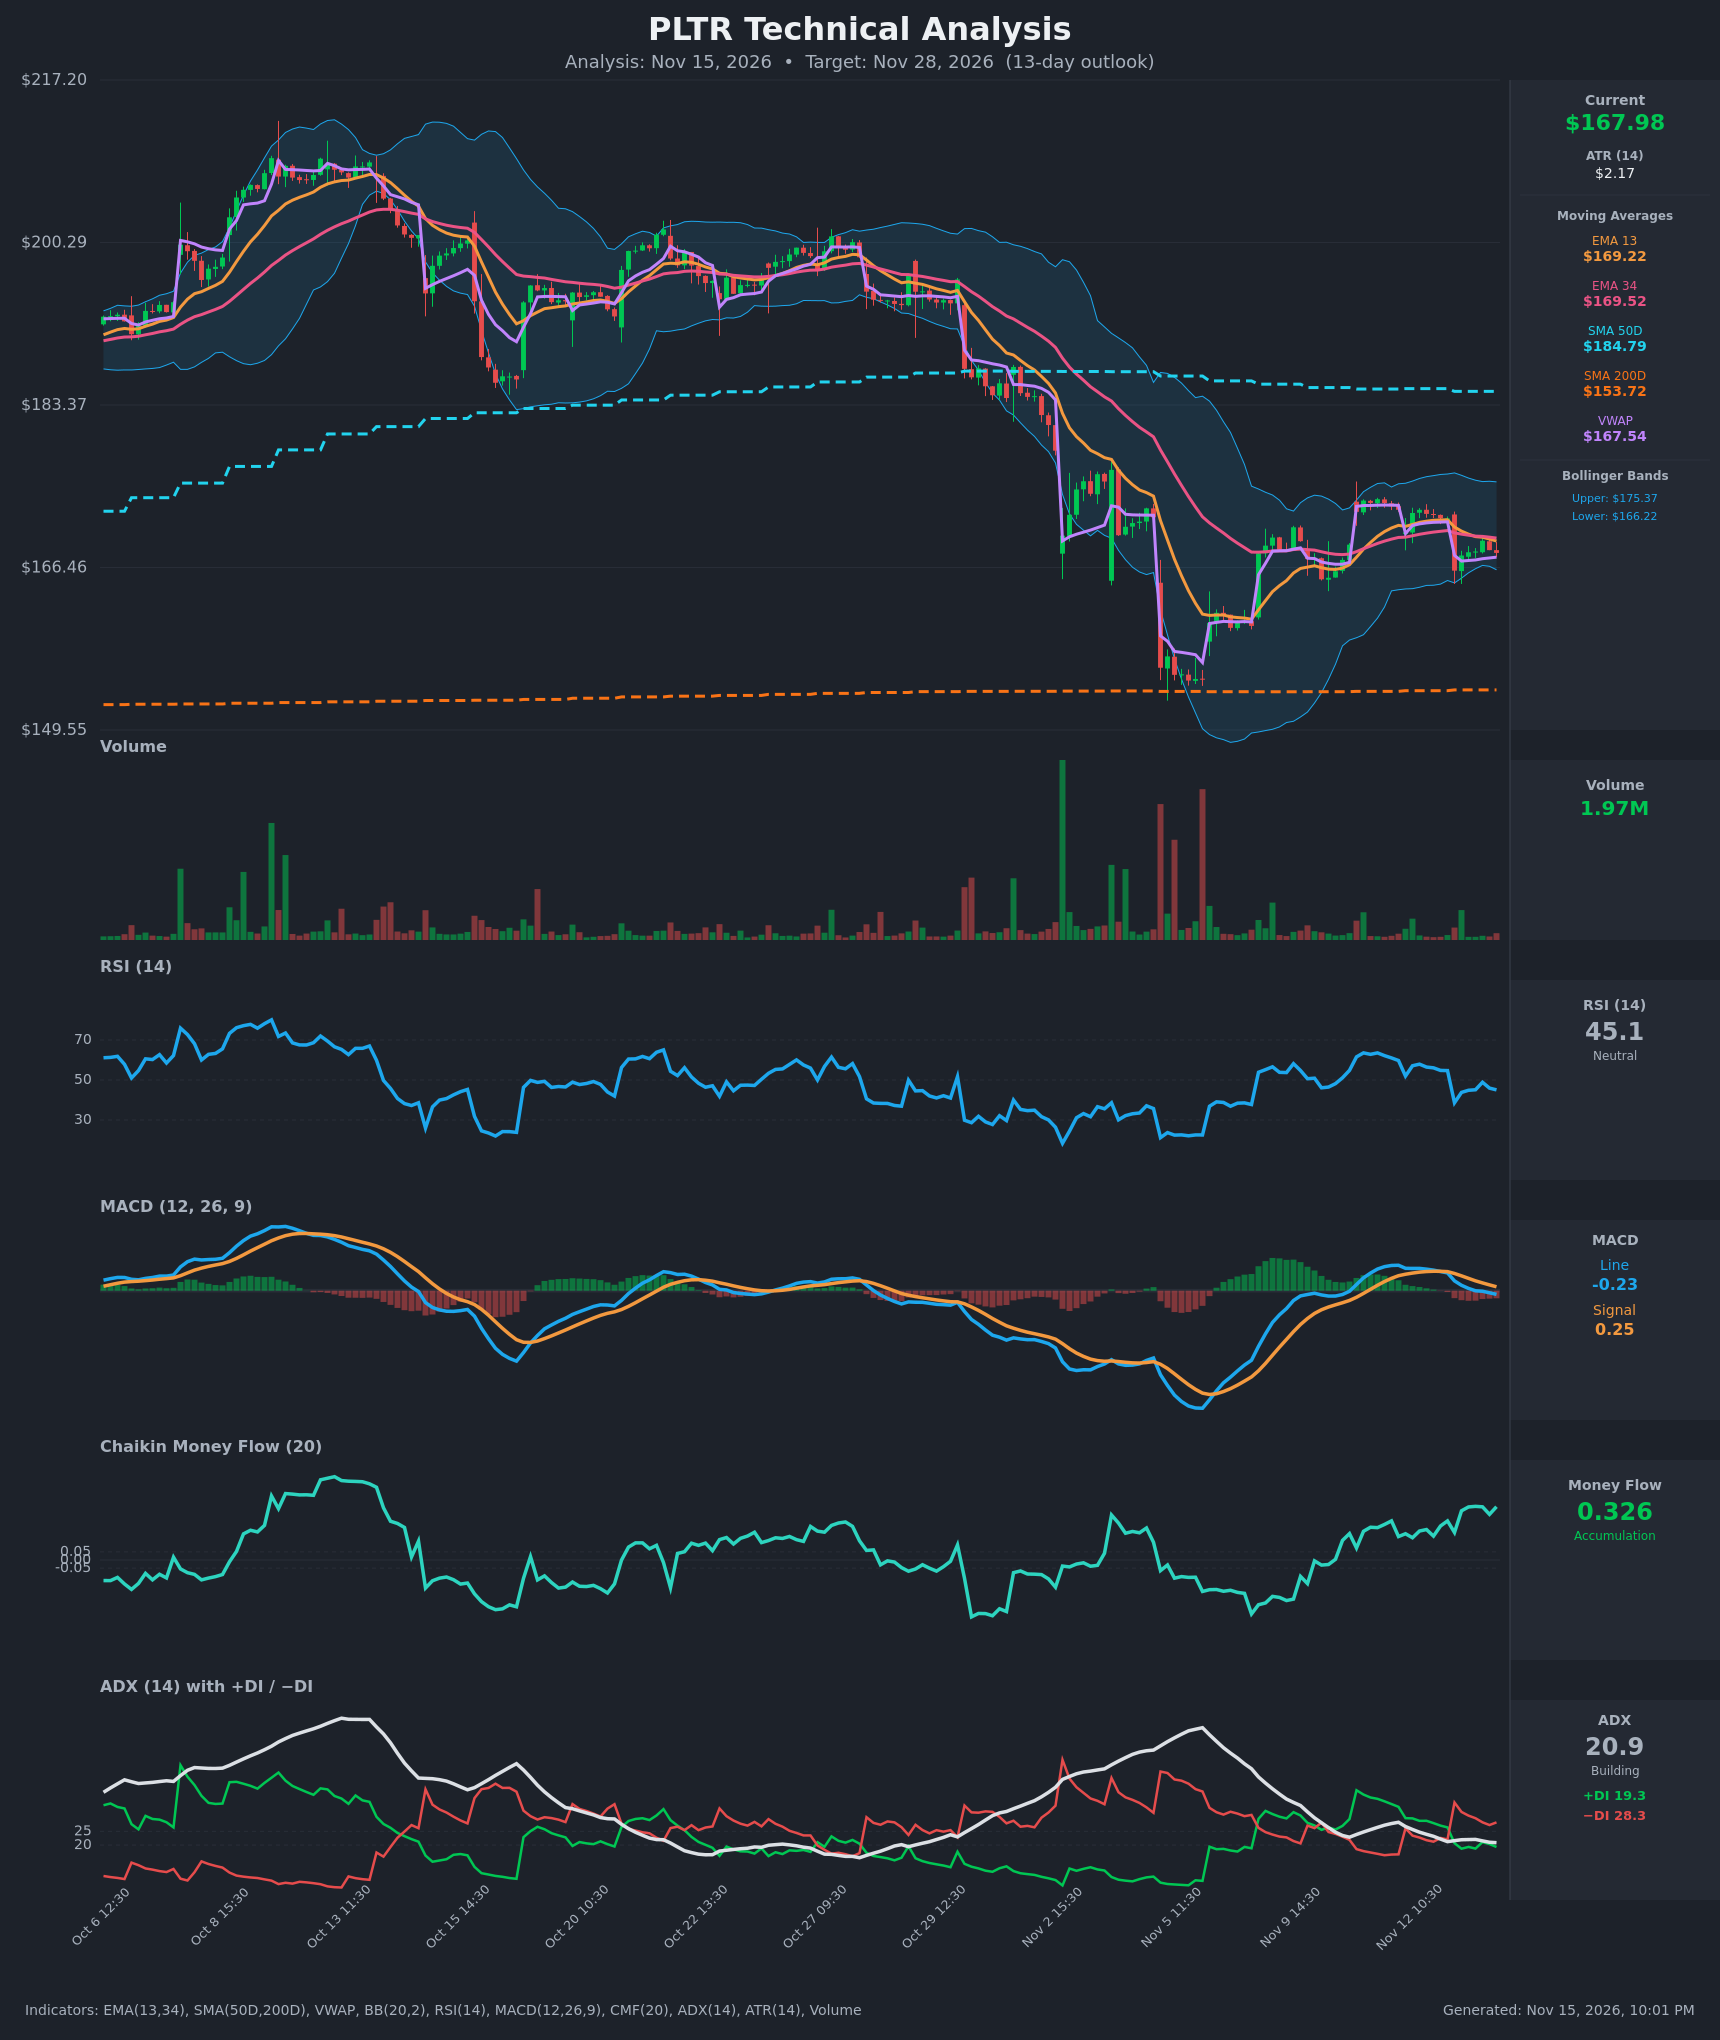
Analysis
TECHNICAL INDICATORS
- RSI (14): 45.07, below the 50 midline and well off the 60s of Nov 11–12. Momentum has rolled over, but it is nowhere near oversold. [Neutral]
- EMA 13 / 34 (20 EMA equivalent): EMA13 is $169.22 and EMA34 is $169.52. Price at $167.98 is below both, and EMA13 has crossed below EMA34 (the Nov 13 12:30 bar). The EMAs are now overhead resistance around $169.2–169.5. [Bearish]
- SMA 50D / 200D: Price is below the SMA50 ($184.79, falling) and above the SMA200 ($153.72, rising). The long-term trend is intact, but the medium-term trend is damaged. [Neutral]
- VWAP: $167.54, with price just above it. This is a marginally positive intraday positioning signal, and VWAP is a nearby pivot. [Neutral]
- MACD: Line is -0.234, signal is +0.254, so the line has crossed below the signal (a bearish crossover on Nov 13 12:30). The histogram is negative and widening, falling from +1.6 to below zero in 3 sessions. Short-term momentum is bearish. [Bearish]
- Bollinger Bands (20): Upper is $175.37 and lower is $166.22, with price at $167.98 in the lower quarter of the band. The bands are narrow compared with the October/early November expansion, which points to contained volatility. Price near the lower band raises the odds of a mean-reversion bounce toward the midline (~$170.8), but a close below $166.22 would signal a downside break. [Neutral]
- CMF (20): 0.326, well above +0.05. It has risen steadily since early November while price has been flat to lower, which signals persistent buying pressure on dips. [Accumulation]
- ADX (14): 20.9 with −DI 28.3 above +DI 19.3. ADX is at the border of weak and building, so there is no strong trend. Sellers lead, and −DI has dominated since the Nov 13 gap lower. [Weak Trend, Bearish lean]
- Volume: 1.97M, which is light compared with the capitulation spikes in early November. The recent pullback is happening on modest volume, so selling is not aggressive. [Neutral / mildly constructive]
DIVERGENCES & TRENDS
- CMF vs. price: CMF is at 0.326 and rising while price has made lower intraday highs (~$172.5 to ~$169.3) and slipped below the EMAs. This is a bullish divergence, showing accumulation into weakness.
- MACD vs. RSI: Both are rolling over together. The MACD bearish crossover and RSI falling from 60 to 45 confirm short-term bearish momentum, so this is not a divergence.
- Crossovers: EMA13 crossed below EMA34, MACD crossed below its signal, and −DI crossed back above +DI. All three are short-term bearish. No golden or death cross is active. The SMA50 is above the SMA200 but converging as the SMA50 declines.
- Trend: The larger structure is a downtrend from ~$210 to ~$150, followed by a recovery to ~$175 and a pullback. The 13-day outlook is a battle between bullish money flow and bearish momentum.
CHART PATTERNS
- The post-low action (Nov 6 low near $150, then the bounce to ~$173–175) looks like a Bullish Flag / Pennant forming within a recovery leg, with a slightly descending consolidation. A break above ~$172.5–175 would target the $180–185 area (SMA50). Confidence is moderate to low, since the pattern is not fully formed.
- A competing read is a lower-high range under the falling SMA50. The failure to hold above the EMAs gives the bearish case some credibility. A loss of $166.2 and then ~$162 would open a retest of the $155–160 base.
- There is no confirmed reversal pattern from the reference diagram. The structure is a consolidation inside a larger corrective bounce.
POTENTIAL SCENARIOS
- Scenario 1: Bullish Mean-Reversion Bounce — Strong CMF accumulation and a lower-band test lead to a rebound through the EMA cluster toward the Bollinger midline and upper band. Trigger: reclaim of $169.50 (EMA13/34) on a closing basis, with MACD histogram turning up. Target: $172–175.4. Invalidation: close below $165.50. (45% probability)
- Scenario 2: Bearish Breakdown — The MACD and DI bearish signals play out and price loses the lower band, leading to a retest of the early-November base. Trigger: close below $166.20 with rising volume. Target: $160–162, then ~$155. Invalidation: close above $170.50. (35% probability)
- Scenario 3: Neutral Range Chop — Weak ADX keeps price between $165 and $172 for the full window. Trigger: repeated failures at the EMAs and holds at the lower band. Target: $166–171. Invalidation: close outside $164–173. (20% probability)
PRICE TARGETS
Timeframe: 13 days, which falls in the 8–12% width band.
- Target Price: $171.50
- Expected Range: $162.00 to $177.00 (width $15.00, about 8.9% of the current price)
- Key Levels: Support at $166.22 (lower Bollinger Band; below that, ~$160), Resistance at $175.37 (upper Bollinger Band; nearer resistance at $169.50 EMA cluster)
OVERALL BIAS
OVERALL BIAS: BULLISH - Strong, persistent CMF accumulation (0.326) with price sitting at the lower Bollinger Band, just above VWAP, and well above the rising SMA200 favors a modest bounce toward $171–172. The bearish MACD/EMA/DI crossovers keep conviction modest, and a close below $166.20 would invalidate the call.
This is educational analysis and not financial advice.