SOFI 13-day bearish forecast — Nov 15, 2026
- Bias: Bearish
- Timeframe: 13 days (made Nov 15, 2026, target date Nov 27, 2026)
- Price at analysis: $15.42
- Price target: $15.00
- Expected range: $14.15 – $15.75
- Result: Pending — graded after the close on Nov 27, 2026
Get a free AI analysis of SOFI today
Analysis
TECHNICAL INDICATORS
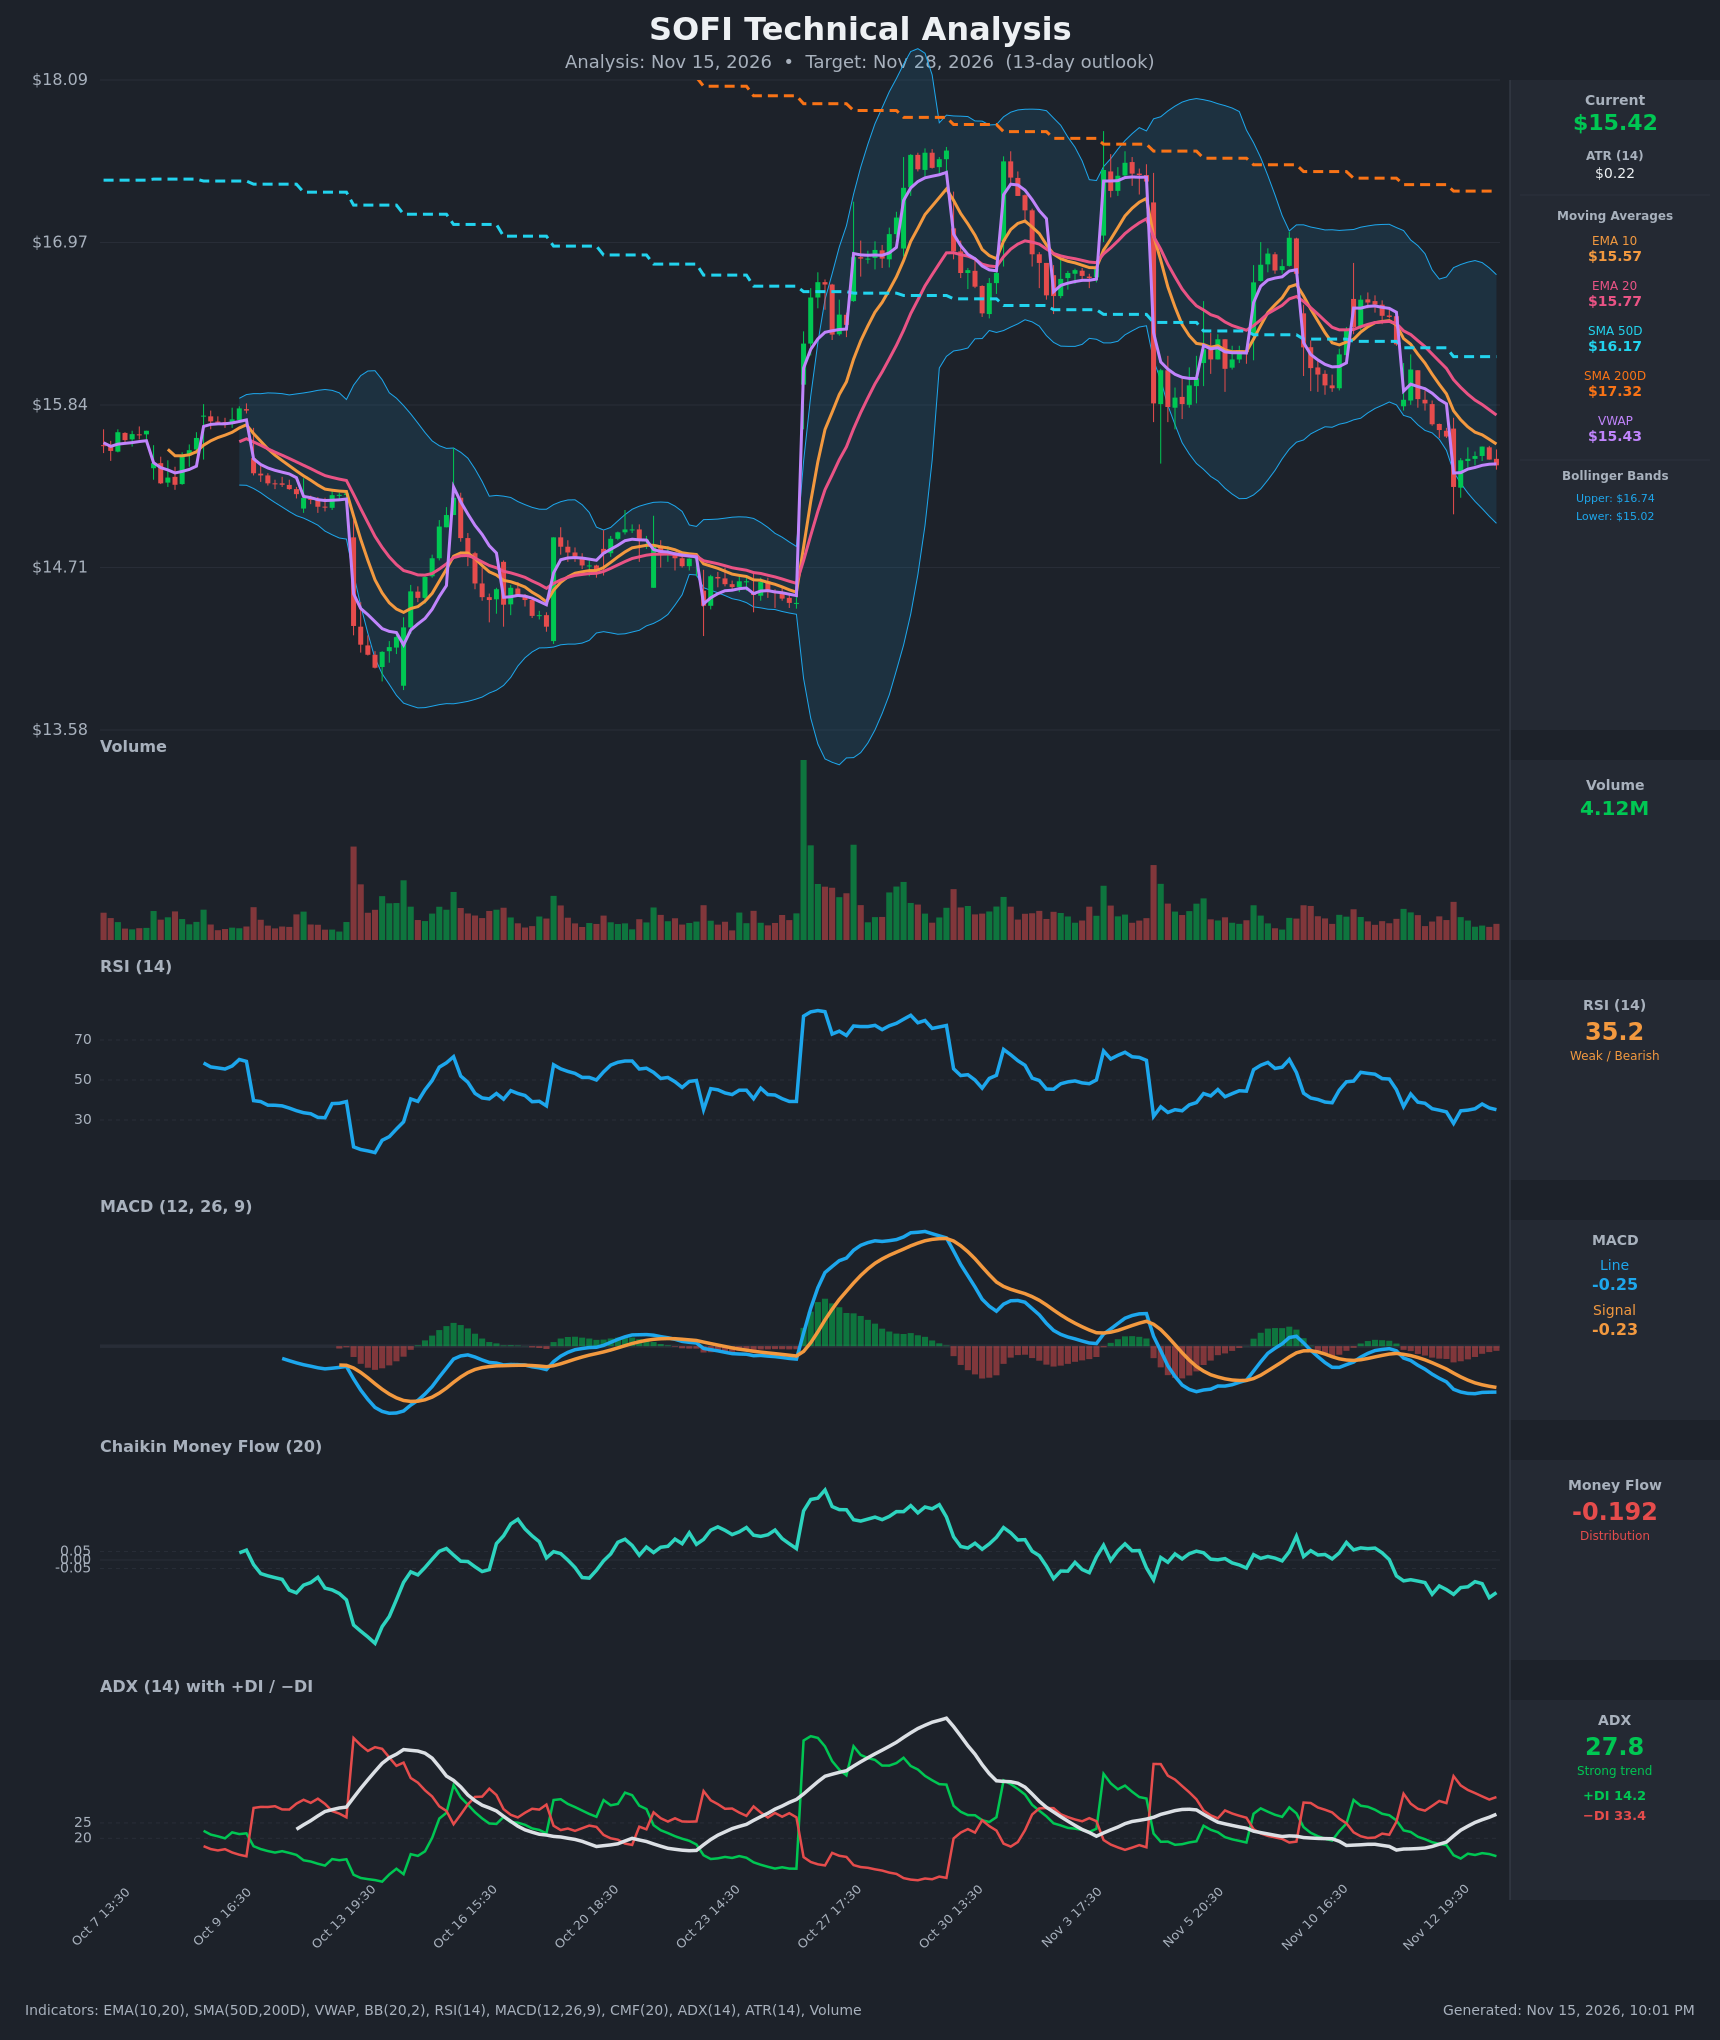
- RSI (14): 35.16, close to oversold (<30) but not there. It bounced off 28.3 on Nov 13 and has since stalled in the mid-30s. Momentum is weak and the chart shows no sustained recovery. [Bearish]
- 20 EMA: $15.77, with price at $15.42 below it. The EMA10 ($15.57) is also below the EMA20 and both are sloping down, so the EMAs act as overhead resistance. EMA10 crossed below EMA20 around Nov 11, a confirmed bearish cross. [Bearish]
- MACD: Line -0.251 is below the signal -0.2255, and both are below zero. The bearish crossover happened around Nov 11-12. The gap is narrowing slightly (-0.260 → -0.251), which hints at momentum stabilizing, but there is no bullish cross yet. [Bearish]
- Bollinger Bands (20): Upper $16.74, lower $15.02, midline about $15.88. Price at $15.42 sits in the lower third of the bands, about 0.4 of the band width above the lower band, which is not yet a squeeze or an extreme. Bands are contracting slightly after the earlier expansion. Price is below the midline, which favors sellers. [Bearish]
- CMF (20): -0.192, well below -0.05. It has been negative for several sessions and made a fresh low, which shows sustained distribution. [Distribution]
- ADX (14): 27.8 and rising (16 → 27.8 over the last 15 bars), with −DI 33.4 far above +DI 14.2. The trend is strong and firmly bearish. [Strong Trend – Bearish]
- Volume: 4.12M, subdued relative to the earlier spike days. Recent red bars are not heavily elevated, so selling is steady rather than capitulative. No volume washout suggests the downtrend may not be exhausted. [Mildly Bearish / No capitulation]
DIVERGENCES & TRENDS
- No bullish divergence is confirmed. The RSI low (28.3) came with the price low on Nov 13, and the subsequent price lows near $15.42 were met with RSI in the mid-30s, so RSI is holding slightly higher than at the low. This is only a very early hint of stabilization, not a divergence signal.
- The MACD histogram is slightly negative and its decline is flattening, so downside momentum is slowing but has not turned.
- Price is below the EMA10, EMA20, SMA50D ($16.17) and SMA200D ($17.32). The SMA50D is also below the SMA200D, which means the death cross is already in place. The long-term trend is down.
- ADX is rising with −DI dominant, which confirms a trend-following bearish regime. DI spread is wide (about 19 points).
- Price is trading just below VWAP ($15.43), roughly flat to it, a slight sellers' edge.
- The structure is a series of lower highs since the early November peak near $17.4: $17.4 → $16.8 → $16.4 → $15.9.
CHART PATTERNS
- Falling channel / lower-highs structure: Since early November, price has made lower highs and lower lows, a bearish continuation structure rather than a reversal. It resembles a Bearish Flag/Pennant continuation after the sharp drop from about $16.4 to $15.3 on Nov 12-13, with the small consolidation in the $15.3-$15.55 range.
- Measured move: The flagpole is roughly $1.1 ($16.4 → $15.3). A break below about $15.25 targets approximately $14.2-$14.5, which also aligns with the prior October consolidation zone ($14.5-$14.7).
- Counter-possibility: A Bullish Double Bottom is possible if $15.27 holds on a retest, but it is not confirmed and needs a neckline reclaim near $15.9 (EMA20/midline).
POTENTIAL SCENARIOS
- Scenario 1: Bearish Flag Breakdown — Price fails at the EMA10/VWAP area and breaks the Nov 13 low, continuing the −DI-led downtrend toward the October consolidation zone. Trigger: close below $15.25 with CMF staying below -0.10. Target: $14.60-$14.90, with an extension to $14.40. Invalidation: daily close above $15.80 (EMA20). (55% probability)
- Scenario 2: Neutral Base and Chop — RSI near 30-35 limits further downside, and price oscillates between $15.0 and $15.9 as the MACD flattens. Trigger: holding $15.02-$15.27 with volume fading. Target: $15.20-$15.60. Invalidation: close below $15.00 or above $15.90. (25% probability)
- Scenario 3: Bullish Oversold Bounce — An oversold relief rally lifts price back to the EMA20/midline, then toward the SMA50D. Trigger: reclaim of $15.80 with a MACD bullish cross and CMF turning above -0.05. Target: $16.15-$16.40. Invalidation: loss of $15.25. (20% probability)
PRICE TARGETS
- Target Price: $15.00 (13 days)
- Expected Range: $14.15 to $15.75 (width $1.60, about 10.4% of the current price, consistent with the 8-12% guidance for 14-21 days and slightly narrower for 13 days)
- Key Levels: Support at $15.02 (lower Bollinger Band; then $14.60), Resistance at $15.77 (EMA20; then $16.17 SMA50D)
OVERALL BIAS
OVERALL BIAS: BEARISH - Price is below all key moving averages with a death cross in place, MACD is below its signal line, ADX at 27.8 rising with −DI far above +DI, and CMF at -0.192 shows persistent distribution. The oversold RSI could allow a bounce, but trend and flow favor a continuation lower toward about $15.00 and the lower range.
This is educational analysis and not financial advice.