RKLB 13-day bearish forecast — Nov 15, 2026
- Bias: Bearish
- Timeframe: 13 days (made Nov 15, 2026, target date Nov 27, 2026)
- Price at analysis: $61.53
- Price target: $59.20
- Expected range: $56.80 – $64.20
- Result: Pending — graded after the close on Nov 27, 2026
Get a free AI analysis of RKLB today
Analysis
TECHNICAL INDICATORS
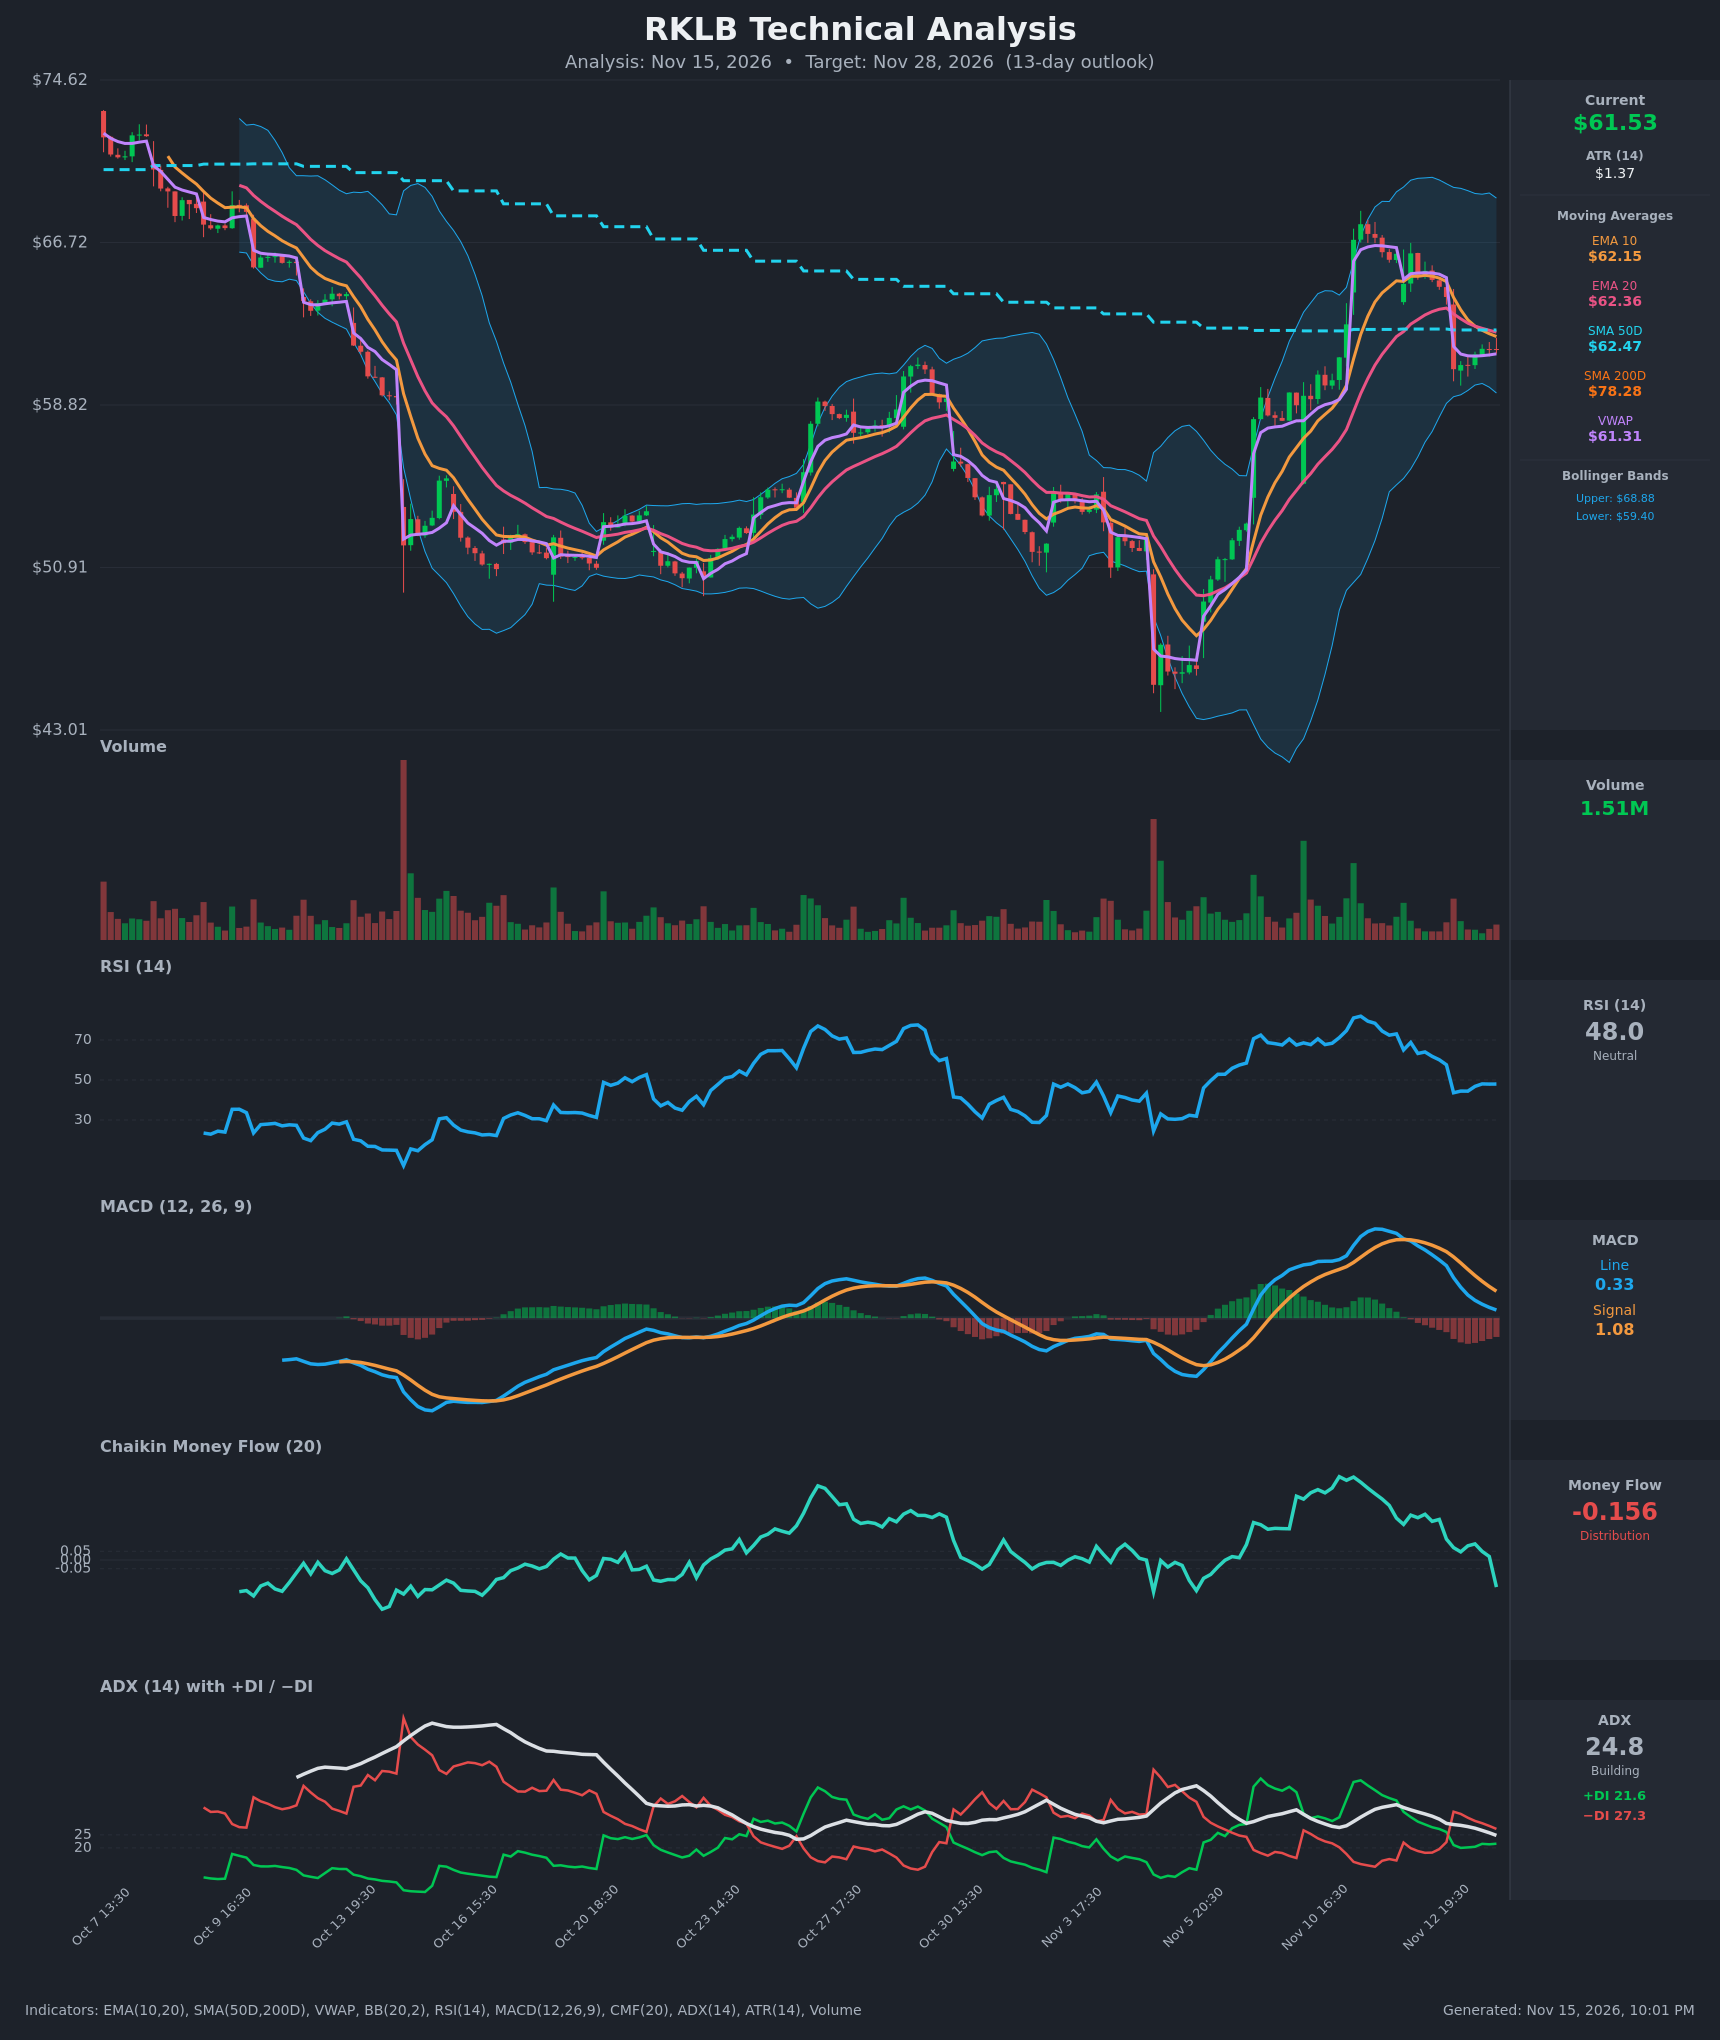
- RSI (14): 47.98, down from 73 on Nov 11 and 65 on Nov 12. It is now flat near 48 after the sharp drop on Nov 13. It sits just below the 50 midline with no oversold or overbought signal, and momentum has clearly faded. [Neutral]
- 20 EMA: $62.36. Price at $61.54 is below the 20 EMA and the EMA 10 ($62.15). The EMA10 is about to cross below the EMA20 after being well above it. The 20 EMA is now overhead resistance. [Bearish]
- MACD: Line 0.325 is below Signal 1.082, a bearish crossover that occurred around Nov 12. The histogram is negative (about -0.76) and still widening, though the line is still above zero. [Bearish]
- Bollinger Bands (20): Upper $68.88, lower $59.40, midline roughly $64.1. Price is in the lower half of the bands, about 1.1 ATR above the lower band. The bands are wide after the November rally, so volatility is elevated. [Neutral]
- CMF (20): -0.156, falling from +0.24 to +0.26 within days. This is a rapid swing into distribution, well below the -0.05 threshold. [Distribution]
- ADX (14): 24.8 and falling from 36.6, so the trend is fading but not yet range-bound. −DI (27.3) is above +DI (21.6), after the DI crossover on Nov 13. Bears hold a modest edge. [Weak/Moderate Trend, Bearish]
- Volume: 1.51M on the latest bar, light compared with the spikes during the rally and the Nov 6 selloff. The Nov 13 gap-down drop to $60.56 shows the sell-off happened on notable volume, while the stabilization since then has been quiet. This suggests weak buying conviction in the bounce. [Neutral to mildly Bearish]
DIVERGENCES & TRENDS
- Price has stabilized at about $60.5–$61.5 after the Nov 13 gap down, but MACD and CMF are still falling, so there is no bullish divergence. Money flow is deteriorating faster than price.
- The EMA10/EMA20 bearish crossover is imminent (62.15 vs 62.36), and the MACD bearish crossover is already confirmed.
- DI flipped to −DI dominance while ADX decays from 36 toward 25, which points to a trend losing its bullish impulse.
- Price is slightly below the SMA50D ($62.47) and far below the SMA200D ($78.28). The SMA50D is below the SMA200D, so the long-term structure is a death-cross regime and the 200D acts as a distant ceiling.
- Price sits just above VWAP ($61.31), a small support. Holding it keeps the bounce alive, and a loss opens a retest of $59.40.
- The prior rally from about $45 to $68 has retraced into a consolidation near $61, roughly 40% of the advance.
CHART PATTERNS
- Bearish flag/pennant after the spike: The rally to $68 followed by a sharp drop and a tight sideways base near $60.5–$61.5 resembles a short-term consolidation. It is not a clean match to the reference diagram.
- Broader structure: The chart shows a large V-shaped recovery (Nov 5–10) followed by a lower high and a breakdown below the EMAs. This is closest to a Bearish Double Top / failed breakout type of reversal, with the $68 peak as the top. The measured pullback target is toward the $56–$58 area, and the neckline-like support is near $59.40.
- Overhead resistance is clustered at $62.15–$62.47 (EMA10, EMA20, SMA50D), so any bounce into that zone is likely to meet supply.
POTENTIAL SCENARIOS
- Scenario 1: Bearish Drift Toward the Lower Band — Price fails at the $62.2–$62.5 EMA/SMA50 cluster, loses VWAP, and slides toward the lower band and the prior breakout zone. Trigger: close below $60.50 (Nov 13 low) and VWAP ($61.31). Target: $57.50–$58.80. Invalidation: daily close above $62.50. (50% probability)
- Scenario 2: Neutral Range Consolidation — Price chops between $59.40 and $62.50 as ADX fades and momentum resets. Trigger: holds the $59.40–$60.50 support and cannot clear the EMA cluster. Target: $60.00–$62.00. Invalidation: close outside $59.00–$63.00. (28% probability)
- Scenario 3: Bullish Reclaim — Buyers reclaim the EMA cluster and the post-gap bounce continues toward the upper half of the Bollinger Bands. Trigger: close above $62.50 on rising volume with CMF turning positive. Target: $65.00–$66.50. Invalidation: loss of $60.50. (22% probability)
PRICE TARGETS
For a 13-day timeframe the range should be ~8–12% of current price. The range of $56.20 to $65.00 has width $8.80, or 14.3%, which is slightly above guidance, so I tighten it to $56.50 to $64.50 (width $8.00, 13.0%). That is still wider than the guidance, so I narrow it again: $56.80 to $64.20 (width $7.40, 12.0%), which sits at the upper end of the 8–12% guidance and accounts for ATR of $1.37 over about 13 sessions.
- Target Price: $59.20 (13 days)
- Expected Range: $56.80 to $64.20
- Key Levels: Support at $59.40, Resistance at $62.47
OVERALL BIAS
OVERALL BIAS: BEARISH - MACD has crossed bearishly, CMF has flipped to strong distribution (-0.156), −DI is above +DI, and price is below the EMA10, EMA20 and SMA50D, with the EMA10 about to cross under the EMA20. The first downside objective is the lower Bollinger Band near $59.40, with $57.50–$58.80 beyond it, while $62.50 is the invalidation level.
This is educational analysis and not financial advice.