SMH 13-day bearish forecast — Nov 15, 2026
- Bias: Bearish
- Timeframe: 13 days (made Nov 15, 2026, target date Nov 27, 2026)
- Price at analysis: $486.63
- Price target: $478.00
- Expected range: $458.00 – $506.00
- Result: Pending — graded after the close on Nov 27, 2026
Get a free AI analysis of SMH today
Analysis
TECHNICAL INDICATORS
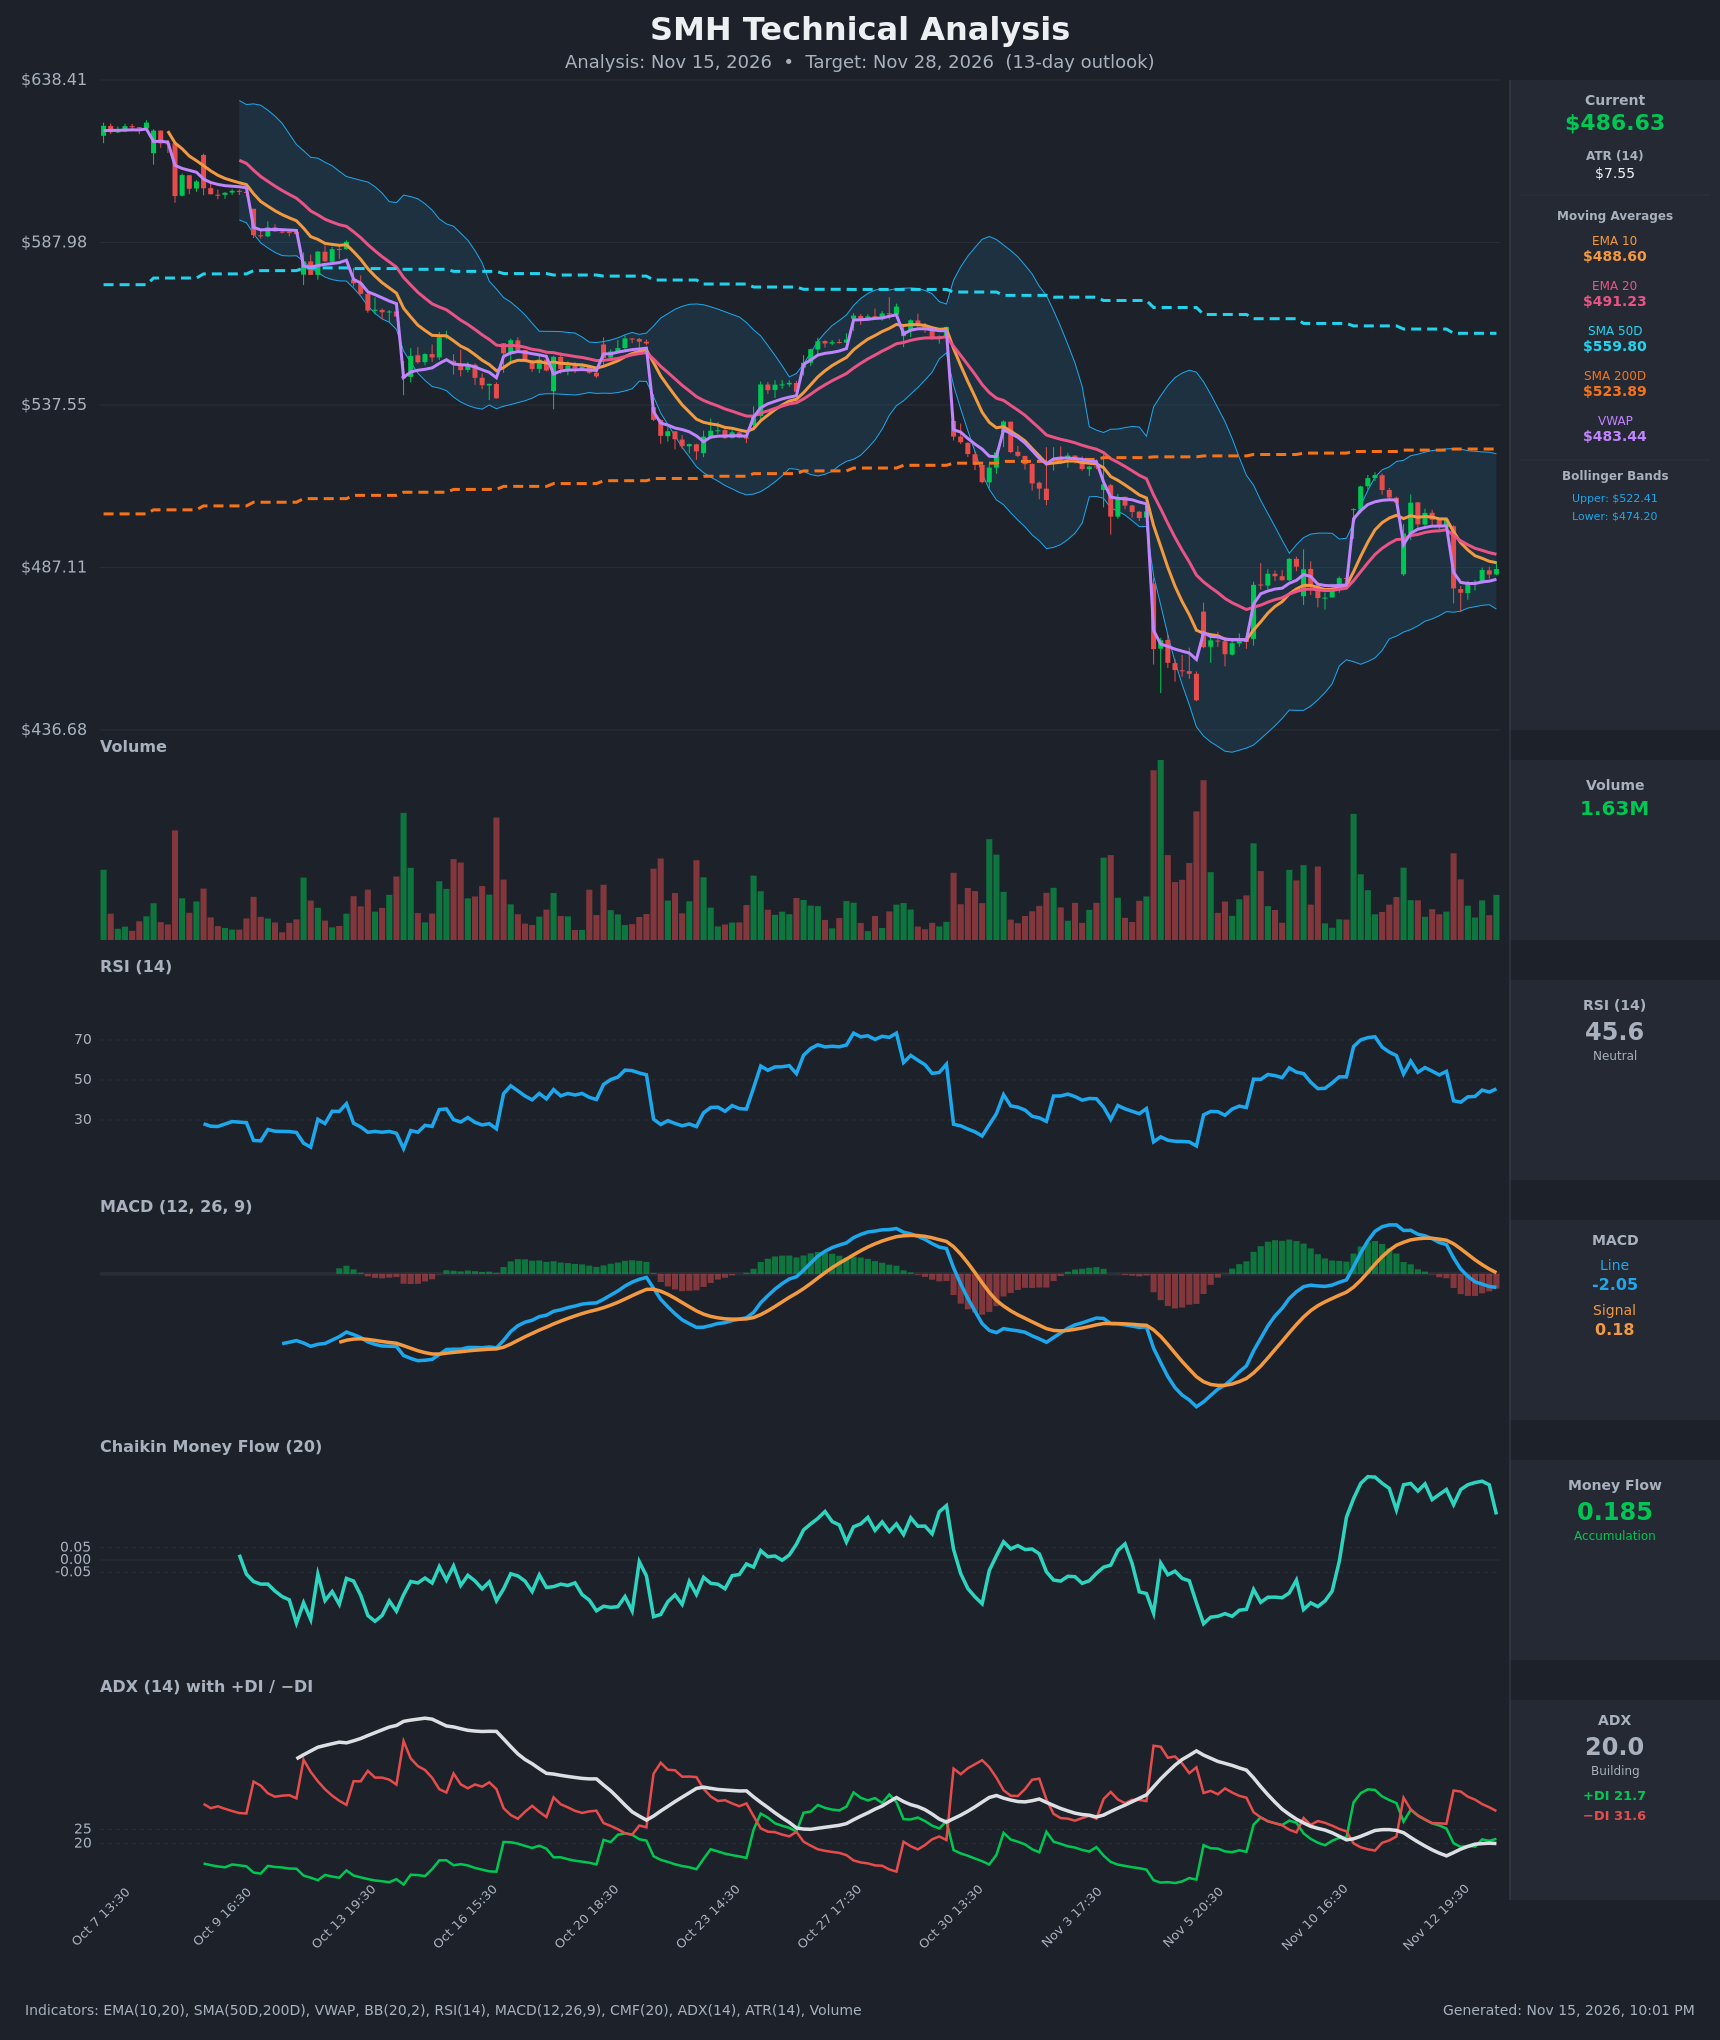
- RSI (14): 45.55, below the 50 midline and well off the 62 seen on Nov 11. It has been choppy (39 to 46) since the Nov 13 gap down. Momentum is soft but not oversold. [Bearish]
- 20 EMA: $491.23, with EMA10 at $488.60 below it. Price at $486.63 is under both, and the EMA10/EMA20 bearish cross occurred around Nov 13. The EMAs now act as overhead resistance. [Bearish]
- MACD: Line -2.05 is below the signal at 0.18, and the histogram is negative and widening. The bearish crossover happened on Nov 13 (16:30), with the line falling from +7.4 to -2.0 in a few sessions. [Bearish]
- Bollinger Bands (20): Upper $522.41, lower $474.20, midline about $498. Price sits in the lower half, about $12 below the midline and about $12 above the lower band. The bands are wide, so volatility is elevated, and there is no squeeze. [Bearish]
- CMF (20): 0.185, above the +0.05 threshold, so it signals accumulation. It has dropped from about 0.32 to 0.185 on the latest bar, and that fading is a warning. This is the main bullish counterweight. [Accumulation]
- ADX (14): 20.0, at the weak/range-bound threshold, with −DI (31.6) well above +DI (21.7). Bears control direction, but trend strength is marginal and has only just stopped falling. [Weak Trend, Bearish direction]
- Volume: 1.63M, in line with the recent average. The heaviest volume came on the Nov 5–6 flush and Nov 13 gap down, so selling has been the higher-volume side. [Neutral to Mildly Bearish]
DIVERGENCES & TRENDS
- Price is below SMA200D ($523.89) and SMA50D ($559.80). The SMA50 is still above the SMA200, so there is no death cross yet. The gap is narrowing quickly, and a cross is plausible if the weakness continues.
- The larger trend has been lower highs and lower lows since the ~$630 area, with failed rallies near $565 (Oct 27) and ~$510 (Nov 11).
- The CMF/price divergence is mild. CMF is positive while price makes lower highs, which suggests dip buying near $460–$480, but CMF is now rolling over.
- The MACD bearish crossover is confirmed, and −DI has dominated +DI since Nov 13. RSI made a lower high (about 71, then about 62).
- Price is slightly above VWAP ($483.44), which is a minor support and the only short-term positive.
CHART PATTERNS
- The decline from ~$630 to $460, followed by a bounce to ~$510 and a pullback, resembles a Bearish Flag/Pennant continuation within a broader downtrend. A break below ~$474 (the lower band) would target roughly $455–$460 (the Nov 5–6 low), and then lower.
- A Bullish Double Bottom is possible if price holds above the $460 low and clears the ~$510 swing high. That is not confirmed and would need a move above the EMA20 and the $498 midline first.
- Recent action is range-like ($460–$510), but the lower highs and bearish momentum favor downside resolution.
POTENTIAL SCENARIOS
- Scenario 1: Bearish Continuation Lower — Price stays under the declining EMAs, MACD remains negative, and −DI stays dominant, pushing price to retest the lower band and possibly the prior low. Trigger: hourly close below $474.20. Target: $460–$470. Invalidation: close above $498 (the BB midline). (50% probability)
- Scenario 2: Bullish Relief Bounce — Positive CMF and a hold above VWAP fuel a rebound toward the EMAs and the Bollinger midline. Trigger: close above $491.23 (EMA20) on rising volume. Target: $505–$510. Invalidation: close below $474. (30% probability)
- Scenario 3: Neutral Chop — Weak ADX keeps price in a $470–$495 range around VWAP. Trigger: failure to break either $474 or $491. Target: about $485. Invalidation: decisive close outside $470–$495. (20% probability)
PRICE TARGETS
- Target Price: $478.00 (13-day)
- Expected Range: $458.00 to $506.00 (width $48 ≈ 9.9% of current price, consistent with the 8–12% guidance for 13 days)
- Key Levels: Support at $474.20, Resistance at $491.23
OVERALL BIAS
OVERALL BIAS: BEARISH - Price is below all key moving averages, with a fresh bearish MACD crossover and −DI well above +DI. Lower highs persist, and only positive (but fading) CMF offers support. Conviction is modest because ADX is weak and the $460–$510 range could hold.
This is educational analysis and not financial advice.