SOXL 13-day bearish forecast — Nov 15, 2026
- Bias: Bearish
- Timeframe: 13 days (made Nov 15, 2026, target date Nov 27, 2026)
- Price at analysis: $58.35
- Price target: $55.50
- Expected range: $52.00 – $59.00
- Result: Pending — graded after the close on Nov 27, 2026
Get a free AI analysis of SOXL today
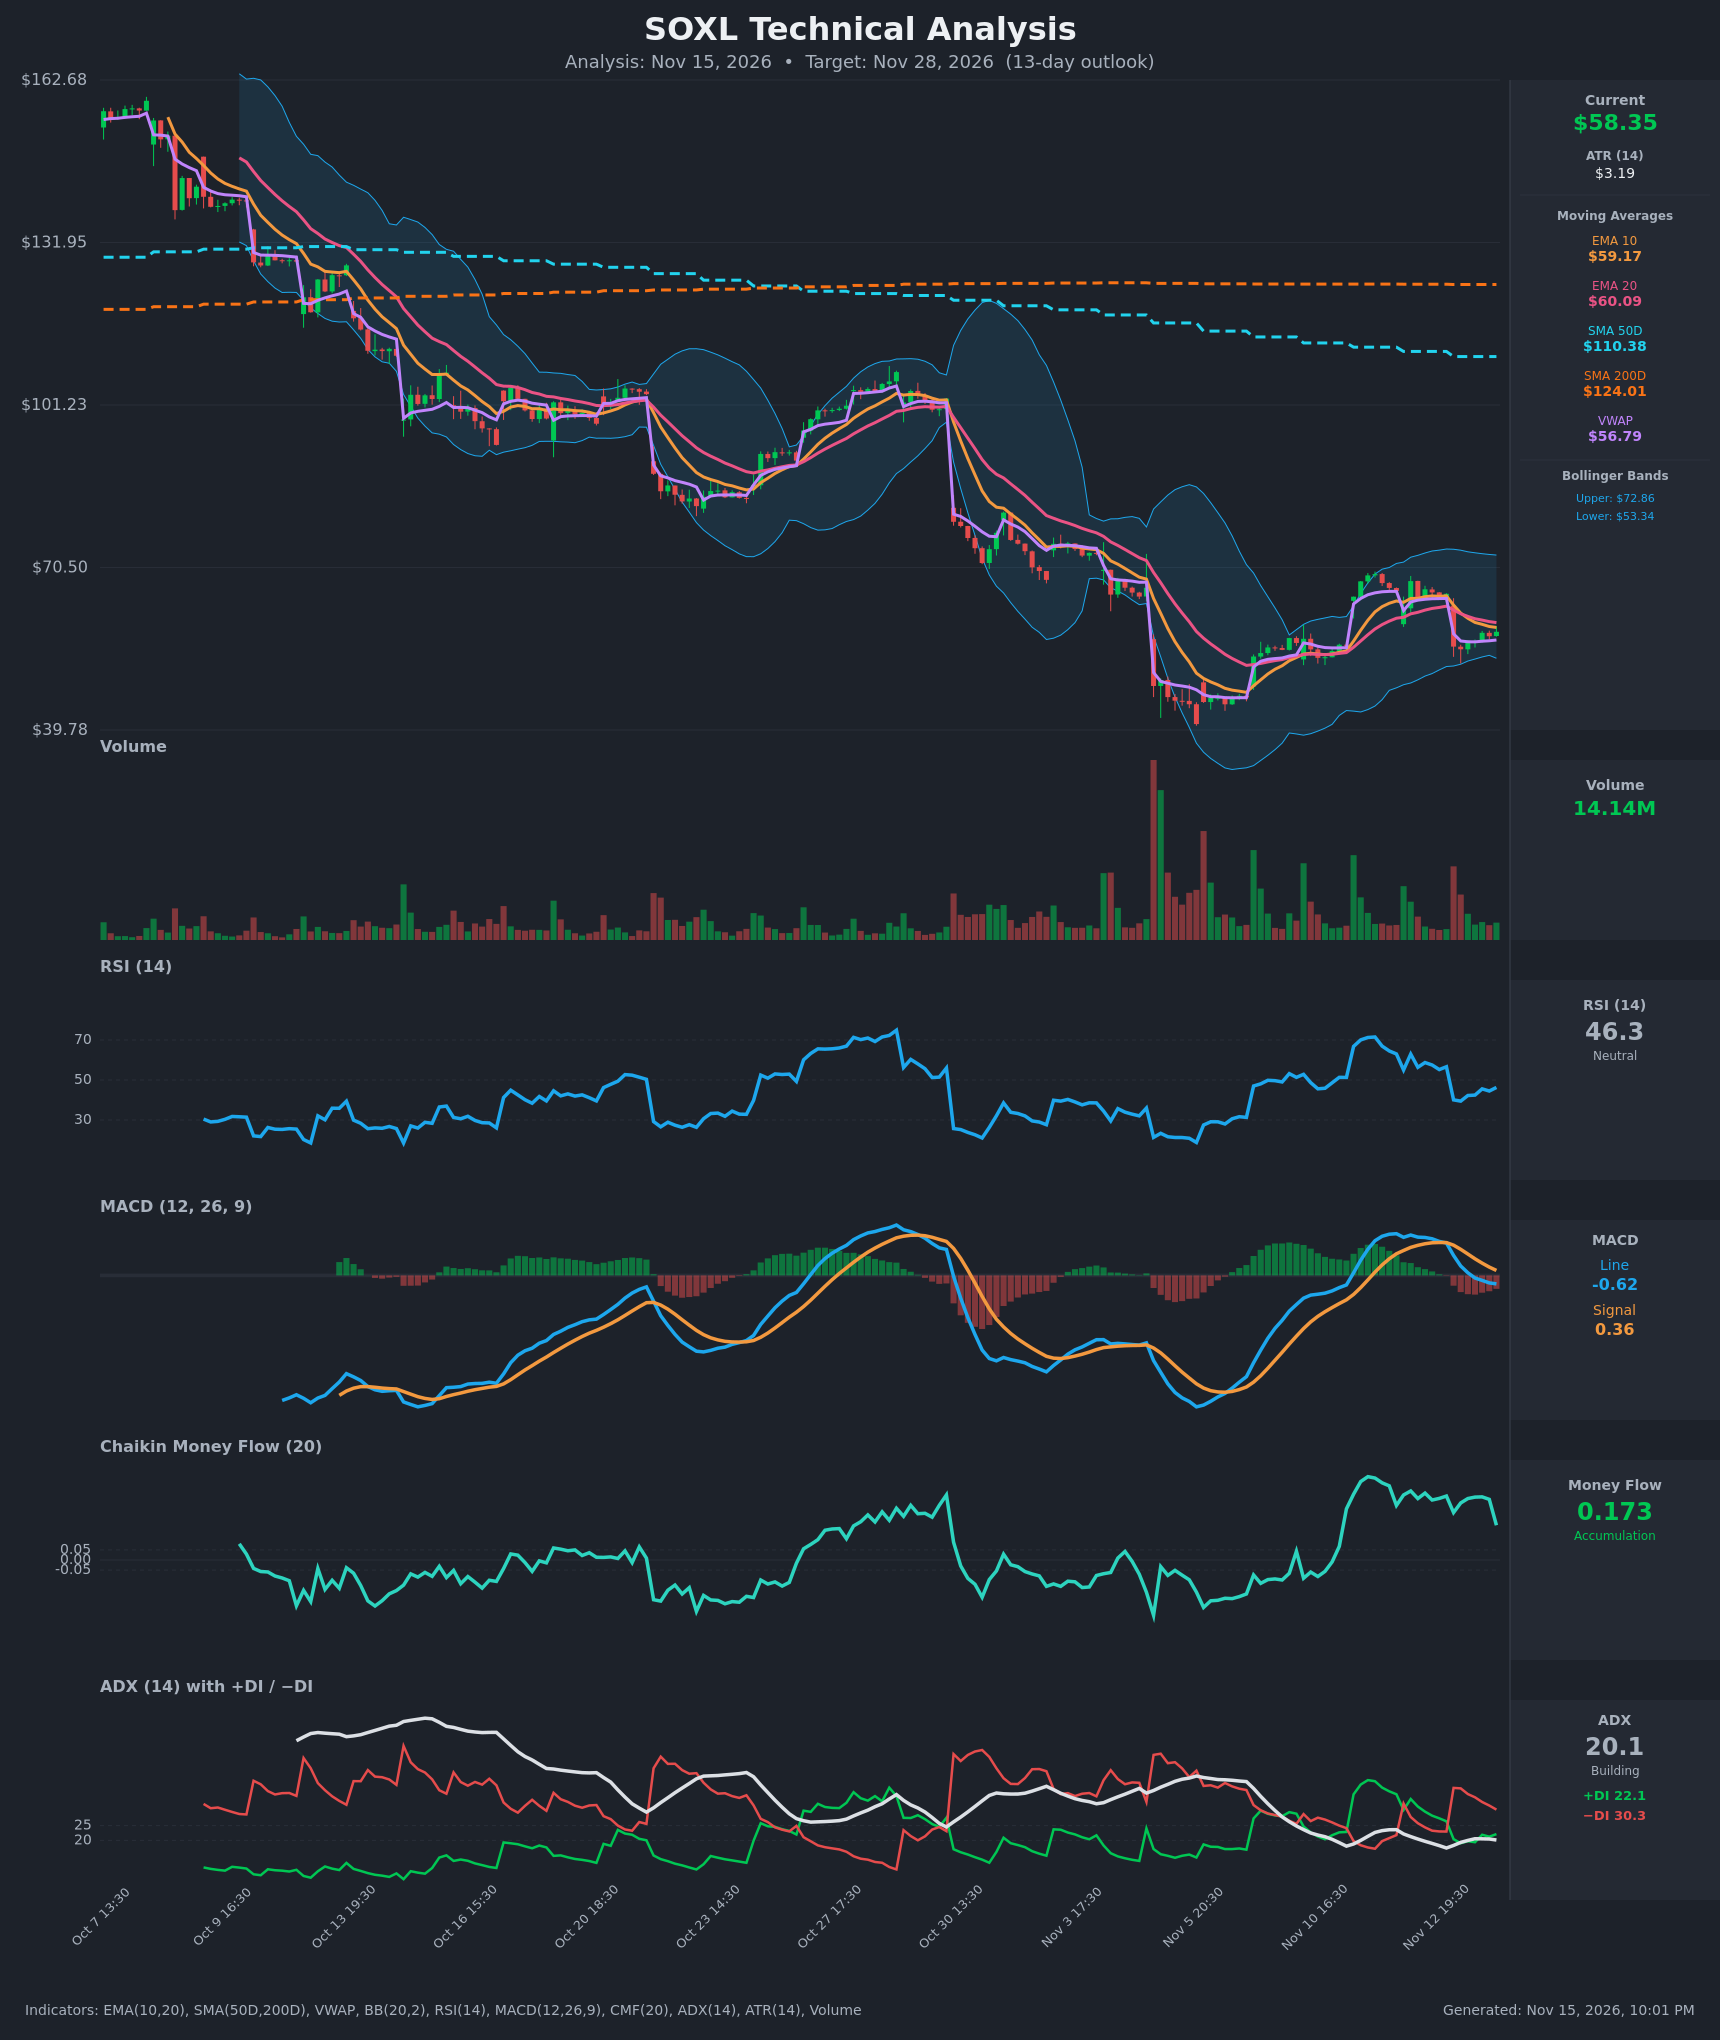
Analysis
TECHNICAL INDICATORS
- RSI (14): 46.28, just under the 50 midline. It has recovered from 39.4 after the Nov 13 gap-down but remains below its earlier 60s readings, so momentum is neutral to slightly weak. [Neutral]
- 20 EMA: $60.09, with price at $58.35 below it. The EMA10 ($59.17) is under the EMA20, a bearish cross that happened on Nov 13. Price sits below both, so the EMAs act as overhead resistance. [Bearish]
- MACD: Line -0.62 is below Signal 0.36, and the histogram is negative and widening. The bearish cross occurred on Nov 13 and the line has just dipped below zero. [Bearish]
- Bollinger Bands (20): Upper $72.86, lower $53.34, midline around $63. Price is in the lower half, about 38% of the way up the band. The bands are wide, so volatility is elevated, and there is no squeeze or band-walk signal. [Neutral]
- CMF (20): 0.173, above the +0.05 threshold. It has been positive (0.17-0.34) throughout the recent bounce, but it dropped from 0.31 to 0.17 on the last bar. Accumulation is still present but fading. [Accumulation]
- ADX (14): 20.1 with −DI 30.3 above +DI 22.1. The trend is weak, but bears are in control since the −DI crossover on Nov 13. The gap is narrowing slightly (−DI 37.6 down to 30.3), so selling pressure is easing. [Weak Trend, Bearish bias]
- Volume: 14.14M on the last bar, which is modest. The heaviest volume came on the red gap-down session (Nov 13), and the bounce since has been on lighter, mixed volume. Price is above VWAP ($56.79), a mild intraday positive. [Neutral to Slightly Bearish]
DIVERGENCES & TRENDS
- Long-term trend: Price is far below the SMA50D ($110.38) and SMA200D ($124.01), and the death cross is already in place. The primary trend is firmly down, from about $162 to a low near $40.
- Bounce structure: The rebound from about $40 to about $68 has stalled with a lower high. The Nov 13 gap from about $65.5 to $55.5 erased much of the advance.
- CMF vs. price: CMF is high and positive while price fell. This is a mild bullish divergence, but CMF is now rolling over, so it is not yet a reliable signal.
- MACD and ADX: MACD turned down and −DI took over, both bearish. ADX is only 20, so the downtrend is not strongly extended and a choppy range is possible.
- Price vs. VWAP: Price is holding above VWAP and recovering slowly, a minor counterweight.
CHART PATTERNS
- Bear flag / bearish pennant (continuation): After the sharp drop on Nov 13, price is forming a small, rising consolidation just under the EMAs. A break below about $55 would target roughly $50-$52, the flagpole measured from the $66 area.
- Broader structure: The bounce from $40 to $68 and the lower high resemble a failed reversal (a double-top-like rejection near $66-$68). It is not a confirmed double top, because the lows between the peaks are not clearly defined.
- Alternative reading: A base between $53 and $68 (a rectangle). A close above $60-$63 (EMA20 and BB midline) would weaken the bearish case.
POTENTIAL SCENARIOS
- Scenario 1: Bearish Failed Bounce / Bear Flag Breakdown — Price is rejected at the EMA20 and EMA10 zone ($59-$60) and rolls over as MACD and −DI stay bearish. It breaks the recent lows near $55 and tests the lower Bollinger Band. Trigger: close below $55.00 on rising volume. Target: $52.00-$53.30. Invalidation: daily close above $60.50. (50% probability)
- Scenario 2: Bullish Reclaim of the Range — CMF accumulation and price above VWAP drive a push back through the EMAs. Price retraces part of the Nov 13 gap toward the BB midline. Trigger: close above $60.10 with MACD histogram turning up. Target: $63-$66. Invalidation: fall back below $56.80 (VWAP). (30% probability)
- Scenario 3: Neutral Choppy Range — With ADX at about 20, price oscillates between $54 and $60 with no resolution. Trigger: failure to break either $54 or $60.50. Target: $56-$59. Invalidation: a close outside $53.30-$60.50. (20% probability)
PRICE TARGETS
- Target Price: $55.50 (13-day horizon)
- Expected Range: $52.00 to $59.00 (width $7.00, about 12% of current price, consistent with the 8-12% guidance for 13 days)
- Key Levels: Support at $53.34 (lower Bollinger Band), Resistance at $60.09 (EMA20)
OVERALL BIAS
OVERALL BIAS: BEARISH - Price is below the declining EMA10/EMA20 and far below the SMA50D/SMA200D (death cross in place). MACD has crossed down, −DI leads +DI, and the bounce has stalled with a lower high. The fading CMF and weak ADX temper conviction, but the weight of evidence favors a drift lower toward $55.50.
This is educational analysis and not financial advice.