SOXS 13-day bullish forecast — Nov 15, 2026
- Bias: Bullish
- Timeframe: 13 days (made Nov 15, 2026, target date Nov 27, 2026)
- Price at analysis: $50.78
- Price target: $52.00
- Expected range: $48.00 – $53.50
- Result: Pending — graded after the close on Nov 27, 2026
Get a free AI analysis of SOXS today
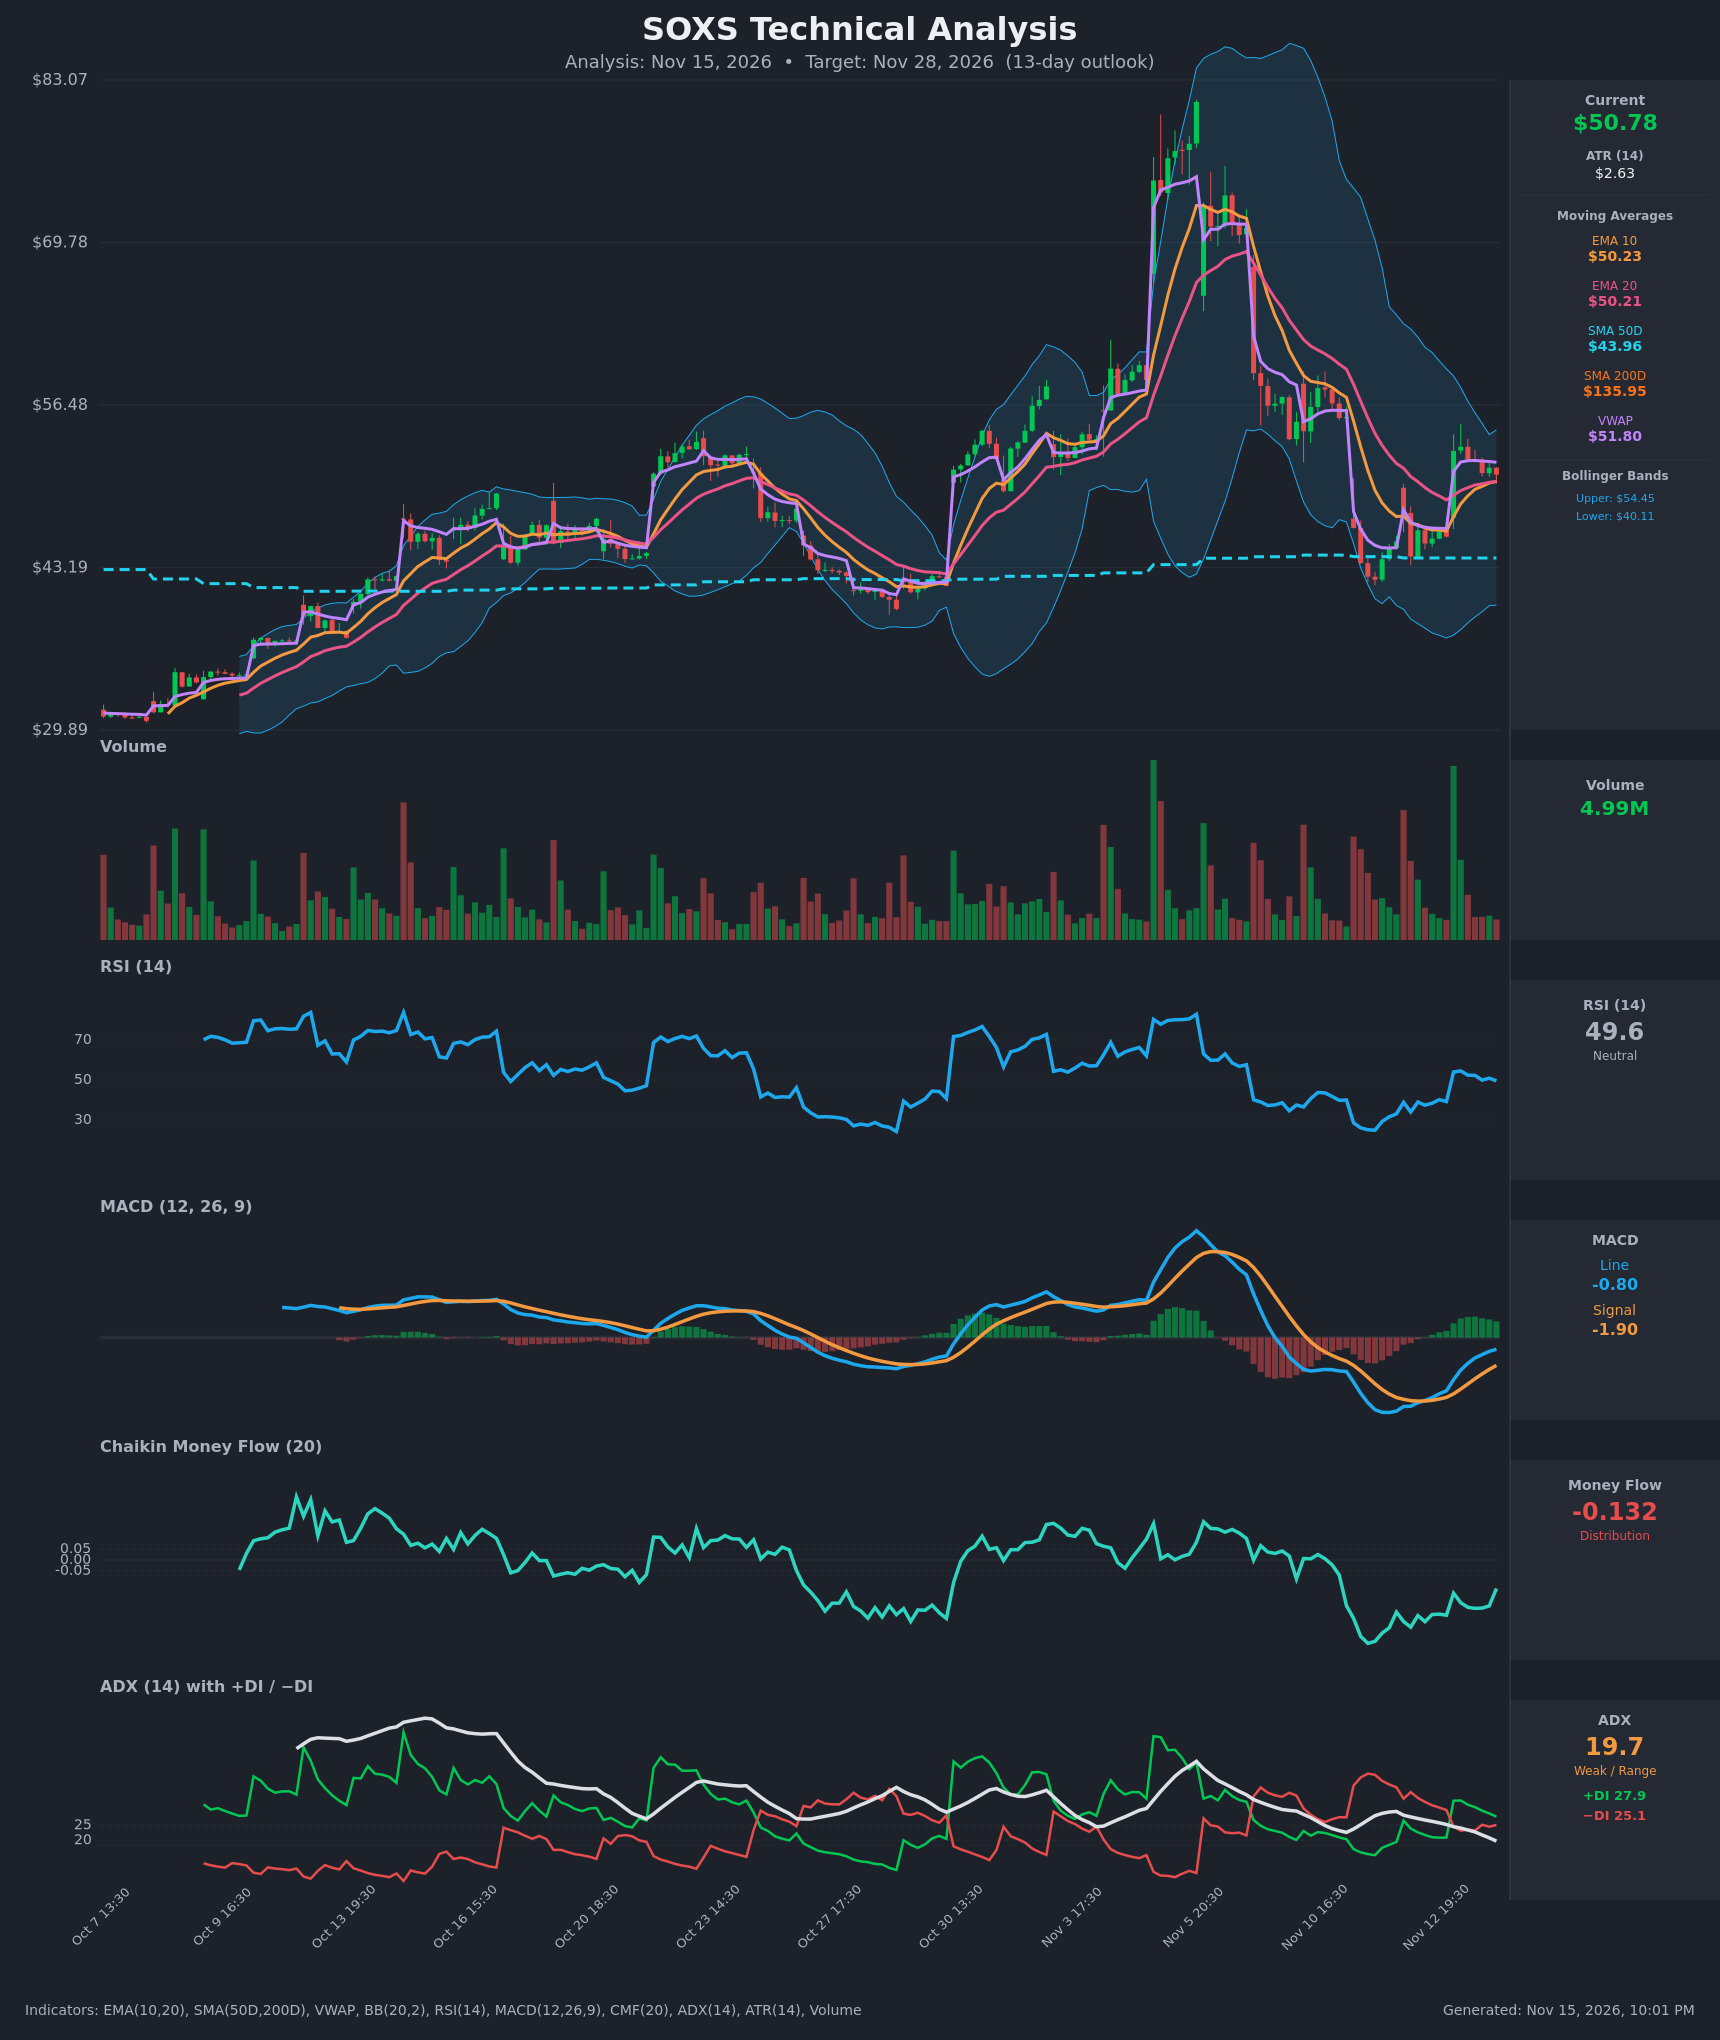
Analysis
TECHNICAL INDICATORS
- RSI (14): 49.57, dead neutral. It spiked from about 39 to 54 on the Nov 13 gap and has drifted back to 50 with no overbought or oversold signal. [Neutral]
- 20 EMA: $50.21, with price at $50.78 just above it. EMA10 ($50.23) has just crossed above EMA20 after trailing it for days. Price is only barely holding this dynamic support. [Bullish]
- MACD: Line -0.80, signal -1.90, histogram about +1.10. The line crossed above the signal around Nov 13 and both are rising, but they are still below zero. This is early-stage momentum recovery, not a confirmed uptrend. [Bullish]
- Bollinger Bands (20): Upper $54.45, lower $40.11, midline about $47.30. Price sits in the upper half, with the bands still wide after the earlier volatility spike. There is room to the upper band, but no squeeze or breakout. [Neutral]
- CMF (20): -0.132, well below -0.05. It has improved from -0.31 but remains in distribution, so the bounce lacks money-flow confirmation. [Distribution]
- ADX (14): 19.7 and falling, so the trend is weak or range-bound. +DI (27.9) is above -DI (25.1), but the gap is narrowing. This is a slight bullish edge with little trend strength. [Weak Trend, slight bullish lean]
- Volume: 4.99M, well below the gap-day surge, with recent bars fading and mixed in color. The post-gap pullback is on light volume, which is typical of a constructive consolidation. [Neutral to mildly Bullish]
Other levels:
- Price is below VWAP ($51.80), a mild bearish tilt.
- SMA50D is $43.96, well below price.
- SMA200D ($135.95) looks distorted, likely by split adjustments, so I give it little weight.
DIVERGENCES & TRENDS
- MACD: The bullish line/signal crossover came from deeply negative territory, and the histogram has flipped positive.
- RSI vs CMF: RSI has rebounded from the 30s to 50, while CMF is still negative at -0.13. This is a mild non-confirmation, so the bounce is not backed by strong buying.
- ADX: It has fallen from about 30 to under 20, which means the prior downtrend has lost strength. The DIs have flipped, with +DI now above -DI.
- EMA10 / EMA20: A fresh bullish cross has just occurred, and the two are nearly flat together.
- Price vs VWAP: Price is slipping from $53.06 toward $50.78 and sits below VWAP, so short-term momentum is fading.
- Gap: The Nov 13 gap ($45.71 to $52.72) is unfilled, and price is holding above it.
CHART PATTERNS
- Bullish Flag / Pennant (continuation): After the sharp gap-up impulse, price is consolidating with a mild downward drift on declining volume. A breakout above about $53.10 would project roughly $56-57, using the flagpole of about $7.
- Failure case: A break below the EMA cluster ($50.2) and then the gap base ($45.7-47.6) would turn this into a failed bounce within the larger lower-high structure, which peaked near $75 and has been declining since.
- Overall structure: Loosely a symmetrical triangle or range between about $46 and $54. The flag is the better fit, given the impulse and the light-volume pullback.
POTENTIAL SCENARIOS
- Scenario 1: Bullish Flag Breakout — Price holds the EMA10/20 cluster and the MACD histogram stays positive. Buyers push through the post-gap highs. Trigger: close above $53.10 on rising volume. Target: $54.45 (upper BB), then $56.50. Invalidation: close below $49.50. (45% probability)
- Scenario 2: Neutral Range Chop — ADX stays under 20 and price oscillates around the EMAs and VWAP. Trigger: failure to clear $53 and no break below $49.5. Target: $49.50-$53.00. Invalidation: a decisive close outside that band. (25% probability)
- Scenario 3: Bearish Gap-Fill — Persistent negative CMF and the rejection under VWAP drag price below the EMAs and into the gap. Trigger: close below $50.20 and then $49.00. Target: $45.70-$47.60. Invalidation: reclaim of $51.80 (VWAP). (30% probability)
PRICE TARGETS
- Target Price: $52.00 (13-day)
- Expected Range: $48.00 to $53.50 (width $5.50, about 10.8% of price, in line with the roughly 8-12% guidance for a timeframe at the boundary of 7-10 and 14-21 days)
- Key Levels: Support at $50.21, Resistance at $53.10
OVERALL BIAS
OVERALL BIAS: BULLISH - A fresh MACD bullish crossover, an EMA10 cross above EMA20, +DI above -DI and a light-volume flag-style consolidation above the gap favor modest upside. Conviction is limited by negative CMF, price below VWAP and weak ADX.
This is educational analysis and not financial advice.