SPY 13-day bearish forecast — Nov 15, 2026
- Bias: Bearish
- Timeframe: 13 days (made Nov 15, 2026, target date Nov 27, 2026)
- Price at analysis: $754.25
- Price target: $747.50
- Expected range: $727.00 – $776.00
- Result: Pending — graded after the close on Nov 27, 2026
Get a free AI analysis of SPY today
Analysis
TECHNICAL INDICATORS
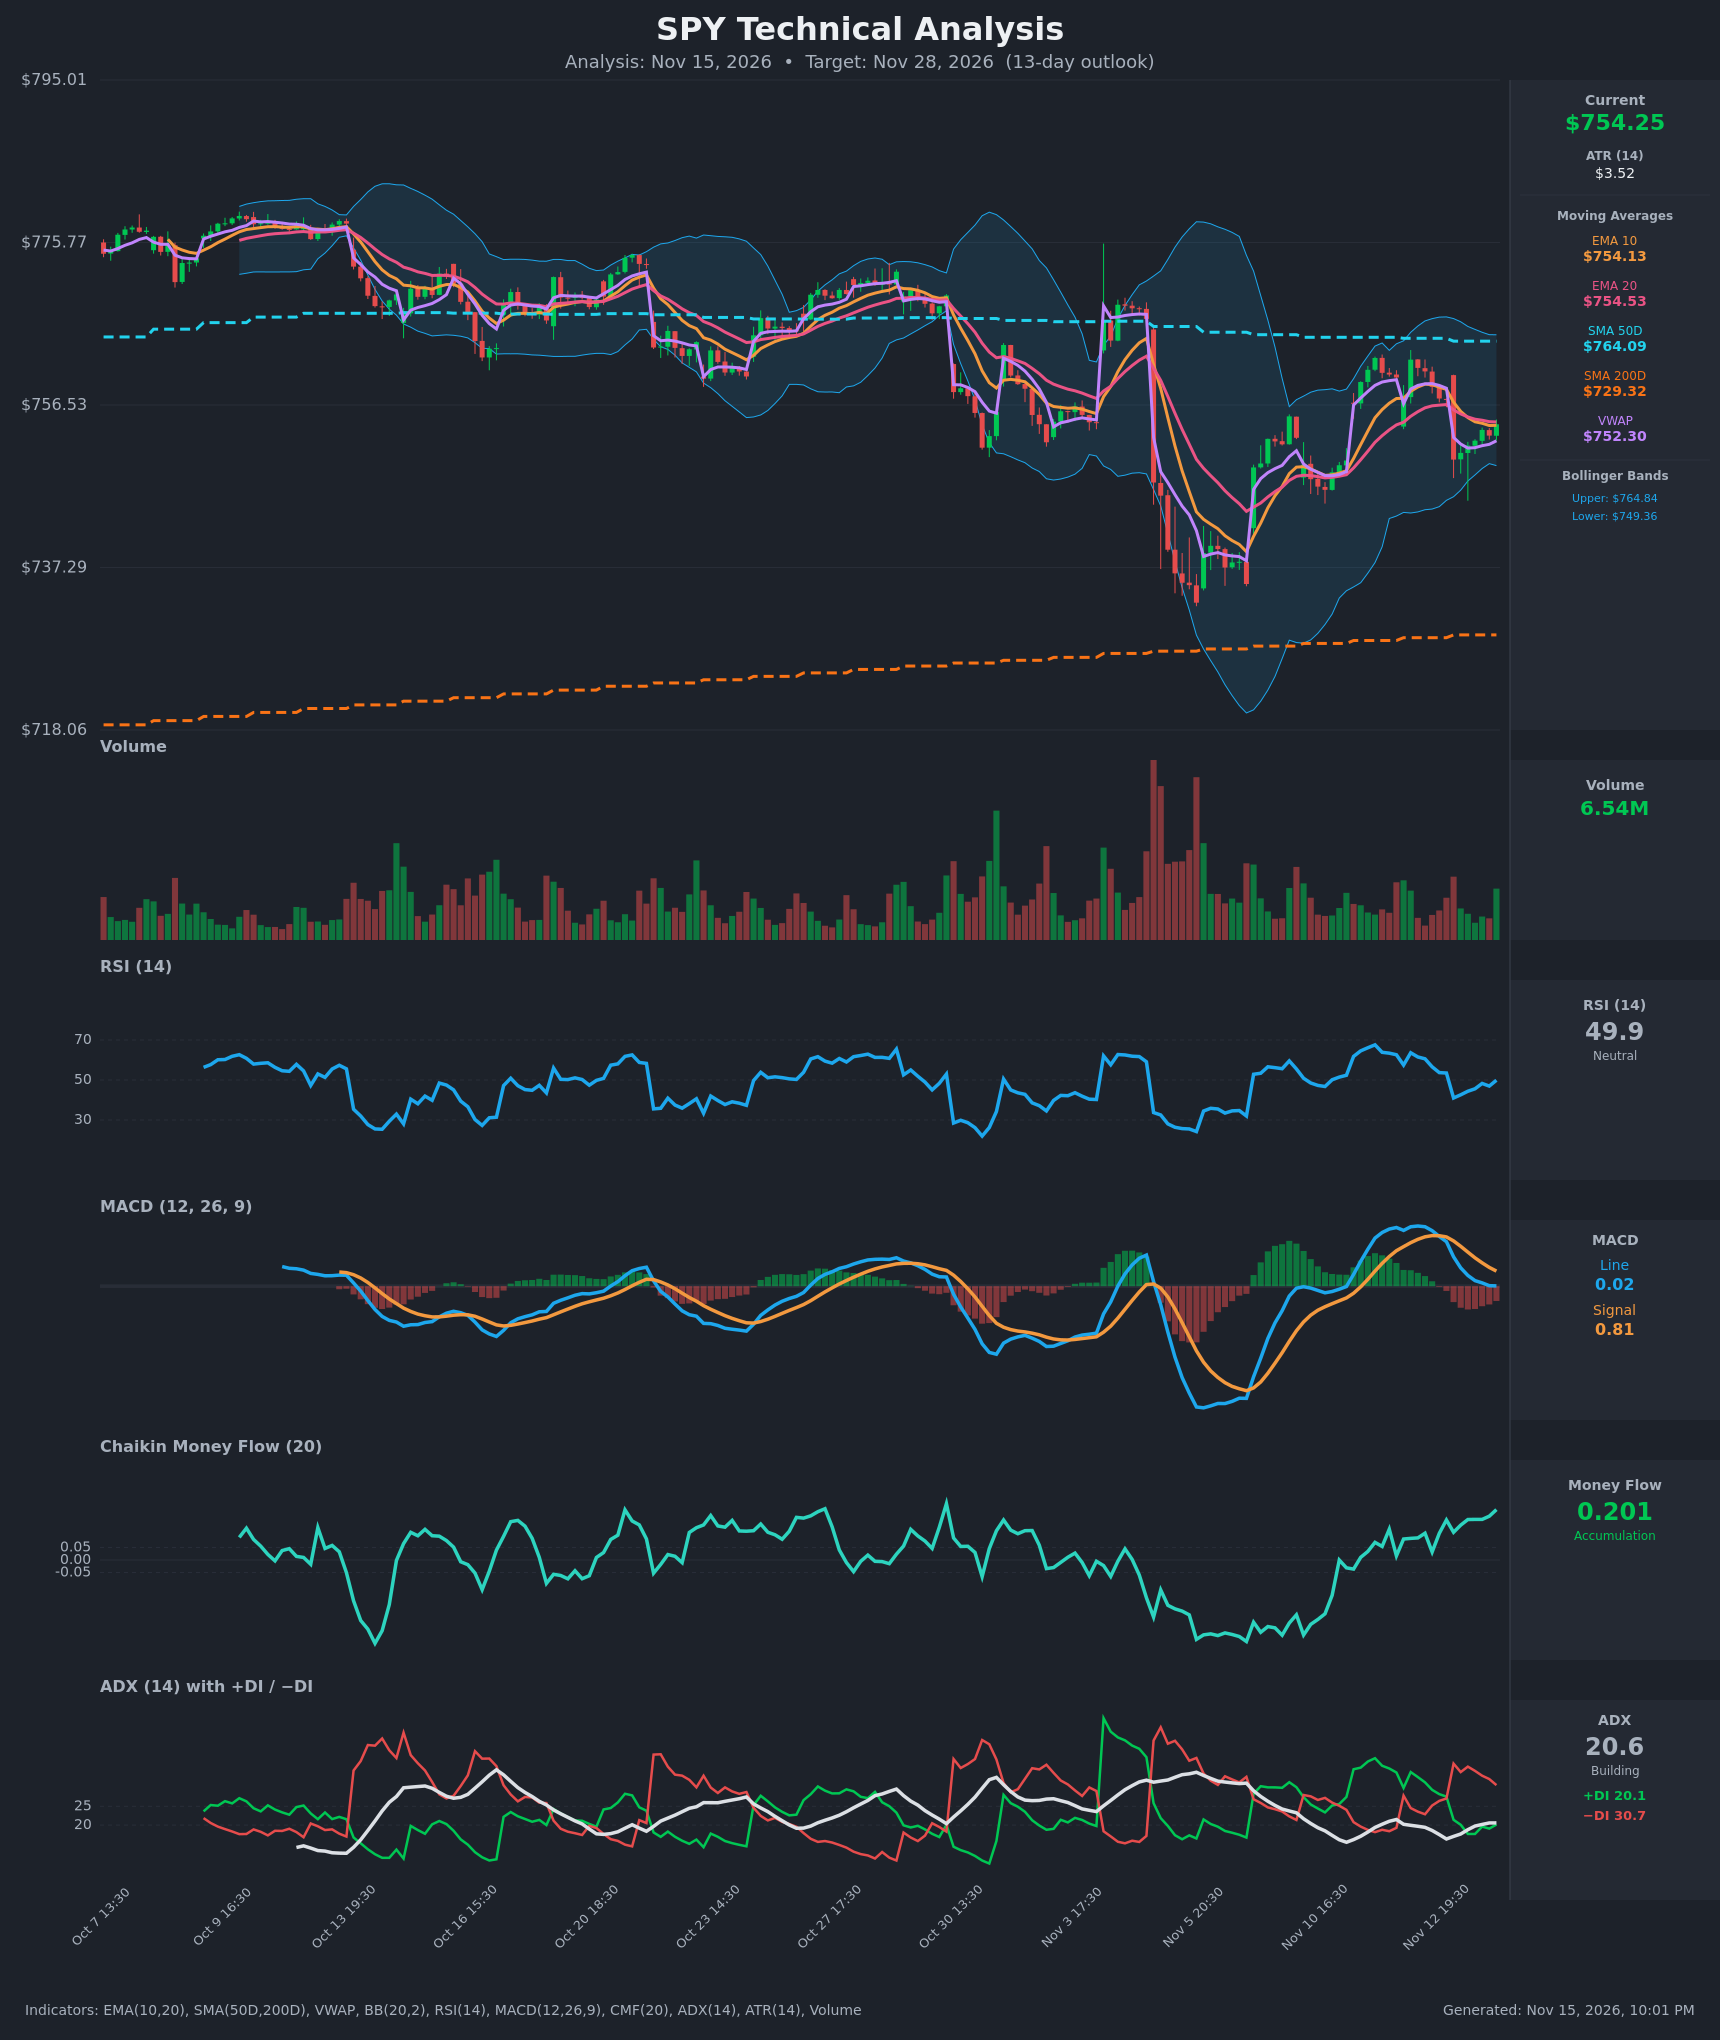
- RSI (14): 49.89, dead neutral. It fell from 63.6 on Nov 12 to a low of 41.0 on Nov 13 and has since recovered to about 50. The bounce shows buyers stepping in, but momentum has not turned positive. [Neutral]
- 20 EMA: $754.53, with EMA10 at $754.13. Price ($754.25) sits between the two, so there is no edge. EMA10 has crossed below EMA20 (about Nov 13 17:30), a mild bearish short-term cross. Price is also below the falling SMA50 ($764.09) and above the rising SMA200 ($729.32). [Neutral]
- MACD: The line is 0.016 and the signal is 0.81. The bearish crossover happened on Nov 12-13, and the line is now flat at the zero line. The histogram is about −0.80, deeply negative but no longer expanding much, which suggests the downside momentum is fading. [Bearish]
- Bollinger Bands (20): Upper $764.84, lower $749.36, midline about $757.10. Price sits in the lower half of the bands, closer to the lower band. The bands are moderate in width after the early-November expansion. A close back above the midline would be constructive, but price is currently capped below it. [Neutral]
- CMF (20): 0.201, well above +0.05 and rising since Nov 12 (0.03 → 0.20). This is clear accumulation, with closes near the highs of recent bars. It is the strongest bullish input on the chart. [Accumulation]
- ADX (14): 20.6 and rising slightly from 16.3, so a trend is only beginning to build. −DI (30.7) is above +DI (20.1), so sellers control direction. Trend strength is still marginal. [Weak Trend, Bearish direction]
- Volume: 6.54M on the latest bar, average to below average. The recent bounce came on unremarkable volume, with no spike confirming a reversal. The largest volume of the period came on the early-November selloff. [Neutral / unconfirmed bounce]
DIVERGENCES & TRENDS
- CMF vs. direction indicators: CMF is rising strongly (accumulation) while −DI dominates and MACD sits below its signal. Price made a lower low on Nov 13 (750.07), but money flow improved afterward. This is a mild bullish divergence in volume-weighted flow versus trend indicators.
- RSI: It made a lower high at 63.6 (Nov 12) compared with about 67 in the prior swing, and it is now back at 50. Momentum peaks are declining.
- Price structure: The swing highs have stepped down from about $777 to $770 to $765 to $761.90, and the Nov 6 low near $735 is the key floor. Price remains trapped below the declining SMA50.
- MACD: The bearish crossover is confirmed and the line is at zero. A recross upward needs a push above about $757.
- Crossovers: EMA10 has dipped below EMA20. There is no golden or death cross: SMA50 ($764) is above SMA200 ($729), so the long-term trend is intact. Price is above VWAP ($752.30), a minor positive.
CHART PATTERNS
- No clean textbook setup. The closest fit is a Bearish Pennant / Bearish Flag-style consolidation. After the sharp drop to about $735 and the rebound to about $767, price has made lower highs and is compressing between $750 and $762.
- Symmetrical Triangle: The compression since Nov 12 loosely resembles this pattern. It is a neutral-to-continuation structure, and a break below $749-750 would point toward a measured move of roughly $735-740.
- Bullish Double Bottom: The $735 low and the Oct 30 low (about $745) do not match closely enough to qualify.
- Overall: The pattern evidence is slightly bearish (lower highs under the SMA50) but not decisive. The range is roughly $735-$767.
POTENTIAL SCENARIOS
- Scenario 1: Bearish Lower-High Rollover — Price fails at the EMA20/BB midline (about $757) and the −DI-led trend pushes it through the lower Bollinger Band. Trigger: hourly close below $749.36 with MACD staying below signal. Target: $740-$747, with an extension toward $735. Invalidation: a sustained close above $758. (45% probability)
- Scenario 2: Bullish Accumulation Breakout — CMF accumulation proves right, MACD recrosses up, and price reclaims the EMAs and the midline, then rotates toward the SMA50 and upper band. Trigger: close above $758 on rising volume. Target: $764-$770. Invalidation: close below $749. (35% probability)
- Scenario 3: Neutral Range Chop — ADX stays near 20 and price oscillates around the 10/20 EMAs between support and resistance. Trigger: no break of $749 or $762. Target: $750-$760. Invalidation: a decisive close outside the $749-$762 band. (20% probability)
PRICE TARGETS
For the 13-day horizon (to Nov 28, 2026), the Expected Range is $727.00 to $776.00. That is a $49.00 width, about 6.5% of the current price, in line with the 7-10 day to 14-21 day guidance for a 13-day window. The range is skewed slightly lower, consistent with the bearish tilt.
- Target Price: $747.50 (13-day)
- Expected Range: $727.00 to $776.00
- Key Levels: Support at $749.36 (lower Bollinger Band; next major support $735), Resistance at $764.09 (SMA50; first resistance at the BB midline near $757)
OVERALL BIAS
OVERALL BIAS: BEARISH - −DI dominates +DI, MACD is below its signal, and price is stuck below a declining SMA50 with a series of lower highs. Strong CMF accumulation and the rising SMA200 limit the downside, so conviction is modest.
This is educational analysis and not financial advice.