XLF 13-day bullish forecast — Nov 15, 2026
- Bias: Bullish
- Timeframe: 13 days (made Nov 15, 2026, target date Nov 27, 2026)
- Price at analysis: $58.67
- Price target: $59.40
- Expected range: $56.50 – $60.90
- Result: Pending — graded after the close on Nov 27, 2026
Get a free AI analysis of XLF today
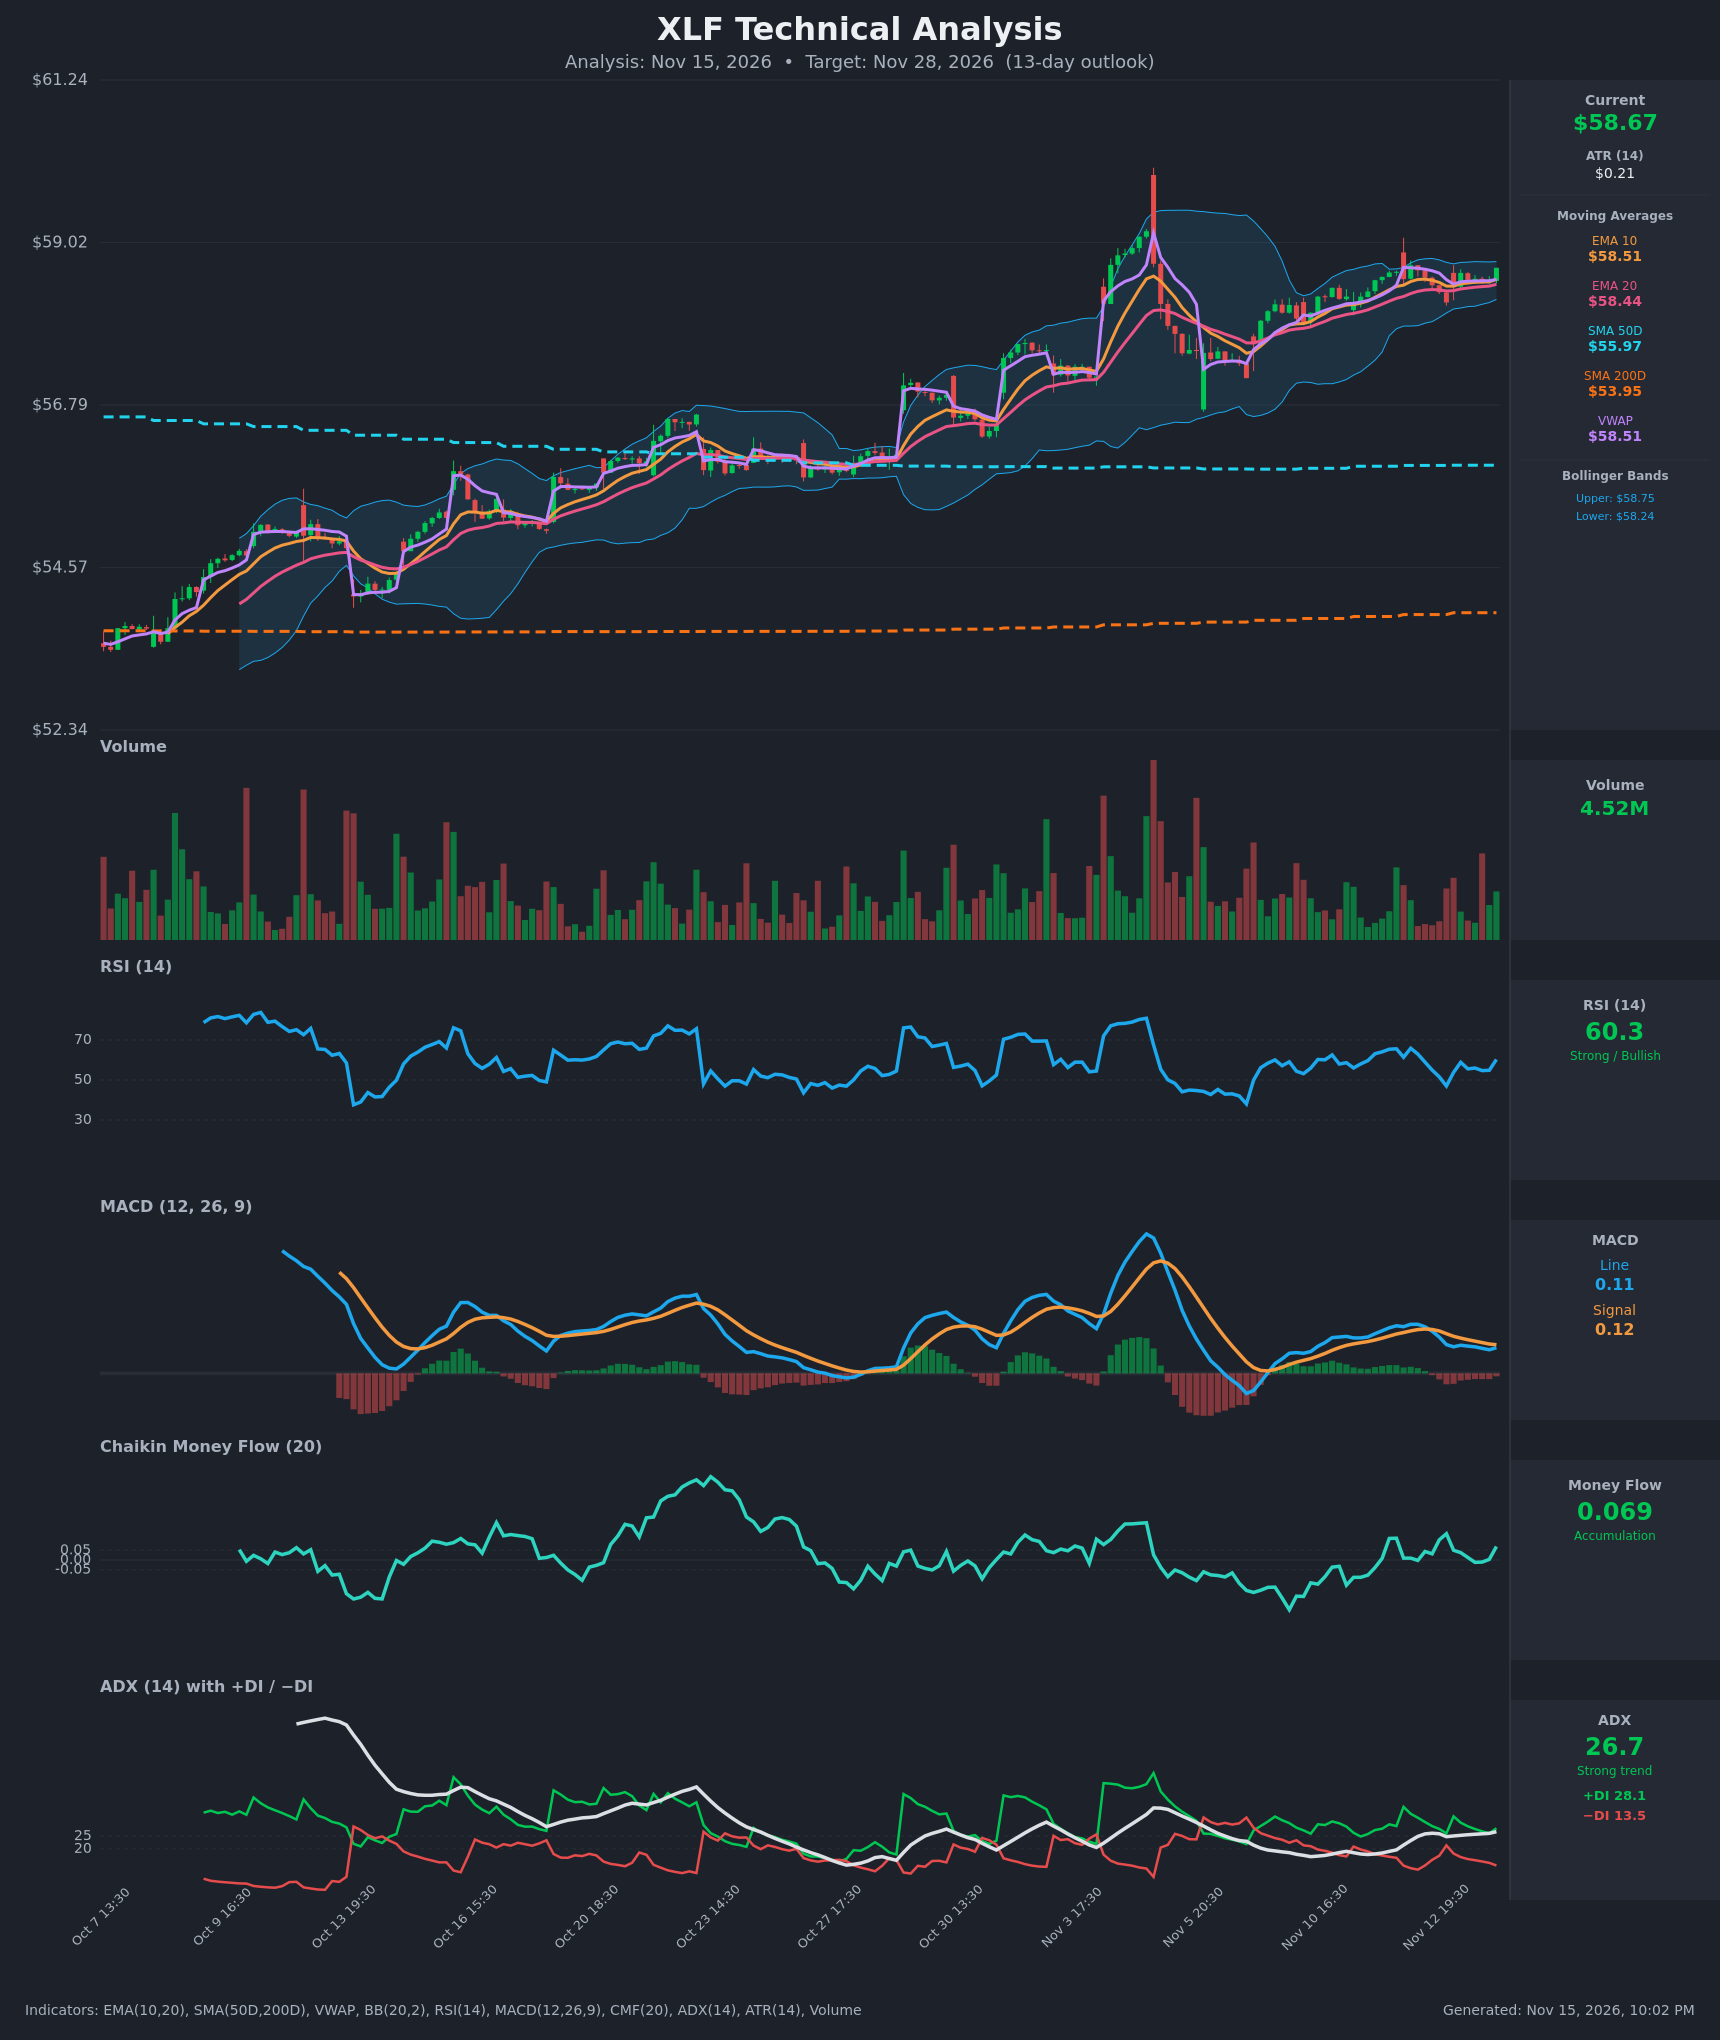
Analysis
TECHNICAL INDICATORS
- RSI (14): 60.27, up from 47 on Nov 12 20:30 and 54.9 an hour before the latest bar. It sits in the bullish zone below overbought (70), with room to run. [Bullish]
- 20 EMA: $58.44, with EMA10 at $58.51 above it. Price at $58.67 is above both, so the EMAs act as support, and EMA10 stays above EMA20 (no bearish cross). [Bullish]
- MACD: Line 0.108 is just below Signal 0.120, with a small negative histogram. The line has been drifting lower since 0.206 on Nov 12 and is flattening. This is a mild momentum cooldown rather than a trend break, and the line is still above zero. [Neutral]
- Bollinger Bands (20): Upper $58.75, lower $58.24, and the bands are narrow. Price at $58.67 is in the upper quarter of the bands, which shows a volatility squeeze and a possible expansion. The close near the upper band leans bullish. [Bullish]
- CMF (20): 0.069, above the +0.05 threshold. It has hovered around zero and is now turning up, which shows mild accumulation. [Accumulation]
- ADX (14): 26.7 and rising slowly, with +DI 28.1 well above −DI 13.5. This is a strong trend with bulls in control. [Strong Trend – Bullish]
- Volume: 4.52M, average to slightly light, with no heavy distribution days in the recent consolidation. The last green bar came on slightly higher volume, which is mildly supportive. [Neutral to mildly Bullish]
DIVERGENCES & TRENDS
- Long-term structure: Price is above SMA50 ($55.97) and SMA200 ($53.95). The 50-day is well above the 200-day, so the golden-cross uptrend is intact, and both averages are sloping up.
- Mild MACD divergence: Price has made higher closes over the past few sessions, while the MACD line has fallen from 0.20 to 0.11. This is a momentum cooldown, but the line has not crossed below zero.
- RSI: It has been oscillating between 47 and 66 without bearish divergence, and it is turning up.
- DI spread: +DI has stayed above −DI throughout the 15-bar table, even during the dip to $58.20.
- Pullback: The Nov 5–6 spike to about $60 (rejected intraday) was followed by a pullback and a steady grind higher. Price has since recovered back above the EMAs and VWAP ($58.51).
- Crossovers: No EMA cross, no SMA cross, and a marginal MACD bearish cross that is flattening.
CHART PATTERNS
- Bullish Pennant / Flag (continuation): After the sharp early-November advance, price has traded in a tight, narrowing range ($58.20–$59.00). The Bollinger squeeze fits this pattern. A breakout above about $59.00–$59.10 would project a measured move toward $59.80–$60.50, near the earlier spike high.
- Ascending Triangle (partial): Higher lows on the pullbacks against flat resistance near $59.0 also fit. A close above $59.10 confirms it.
- Failure level: A move below $58.20 would invalidate both patterns.
POTENTIAL SCENARIOS
- Scenario 1: Bullish Pennant Breakout — The squeeze resolves upward with the trend, and ADX and +DI keep bulls in control. Trigger: a close above $59.10 on rising volume. Target: $59.40 to $60.30. Invalidation: a close below $58.20. (55% probability)
- Scenario 2: Neutral Consolidation Continues — Price keeps chopping around the EMAs and VWAP while MACD resets to zero. Trigger: failure to break $59.10 and holding above $58.20. Target: $58.30 to $58.90. Invalidation: a close beyond either boundary. (25% probability)
- Scenario 3: Bearish Breakdown / Deeper Pullback — MACD rolls over below zero and price loses the EMAs. Trigger: a close below $58.20 on volume. Target: $57.20, then SMA50 near $56.00. Invalidation: a reclaim of $58.75. (20% probability)
PRICE TARGETS
- Target Price: $59.40 (13-day horizon)
- Expected Range: $56.50 to $60.90 (width $4.40, about 7.5% of the current price, matching the 7–10 day band and scaled up for 13 days)
- Key Levels: Support at $58.20, Resistance at $59.10
OVERALL BIAS
OVERALL BIAS: BULLISH - The long-term uptrend is intact, with price above the SMA50 and SMA200. ADX is 26.7 with +DI far above −DI, CMF shows mild accumulation, and RSI is turning up. The squeeze near highs (pennant/ascending triangle) favors an upside resolution, though MACD flattening argues for a modest target.
This is educational analysis and not financial advice.