NBIS 20-day bearish forecast — Nov 15, 2026
- Bias: Bearish
- Timeframe: 20 days (made Nov 15, 2026, target date Dec 4, 2026)
- Price at analysis: $115.88
- Price target: $107.50
- Expected range: $100.50 – $113.50
- Result: Pending — graded after the close on Dec 4, 2026
Get a free AI analysis of NBIS today
Analysis
TECHNICAL INDICATORS
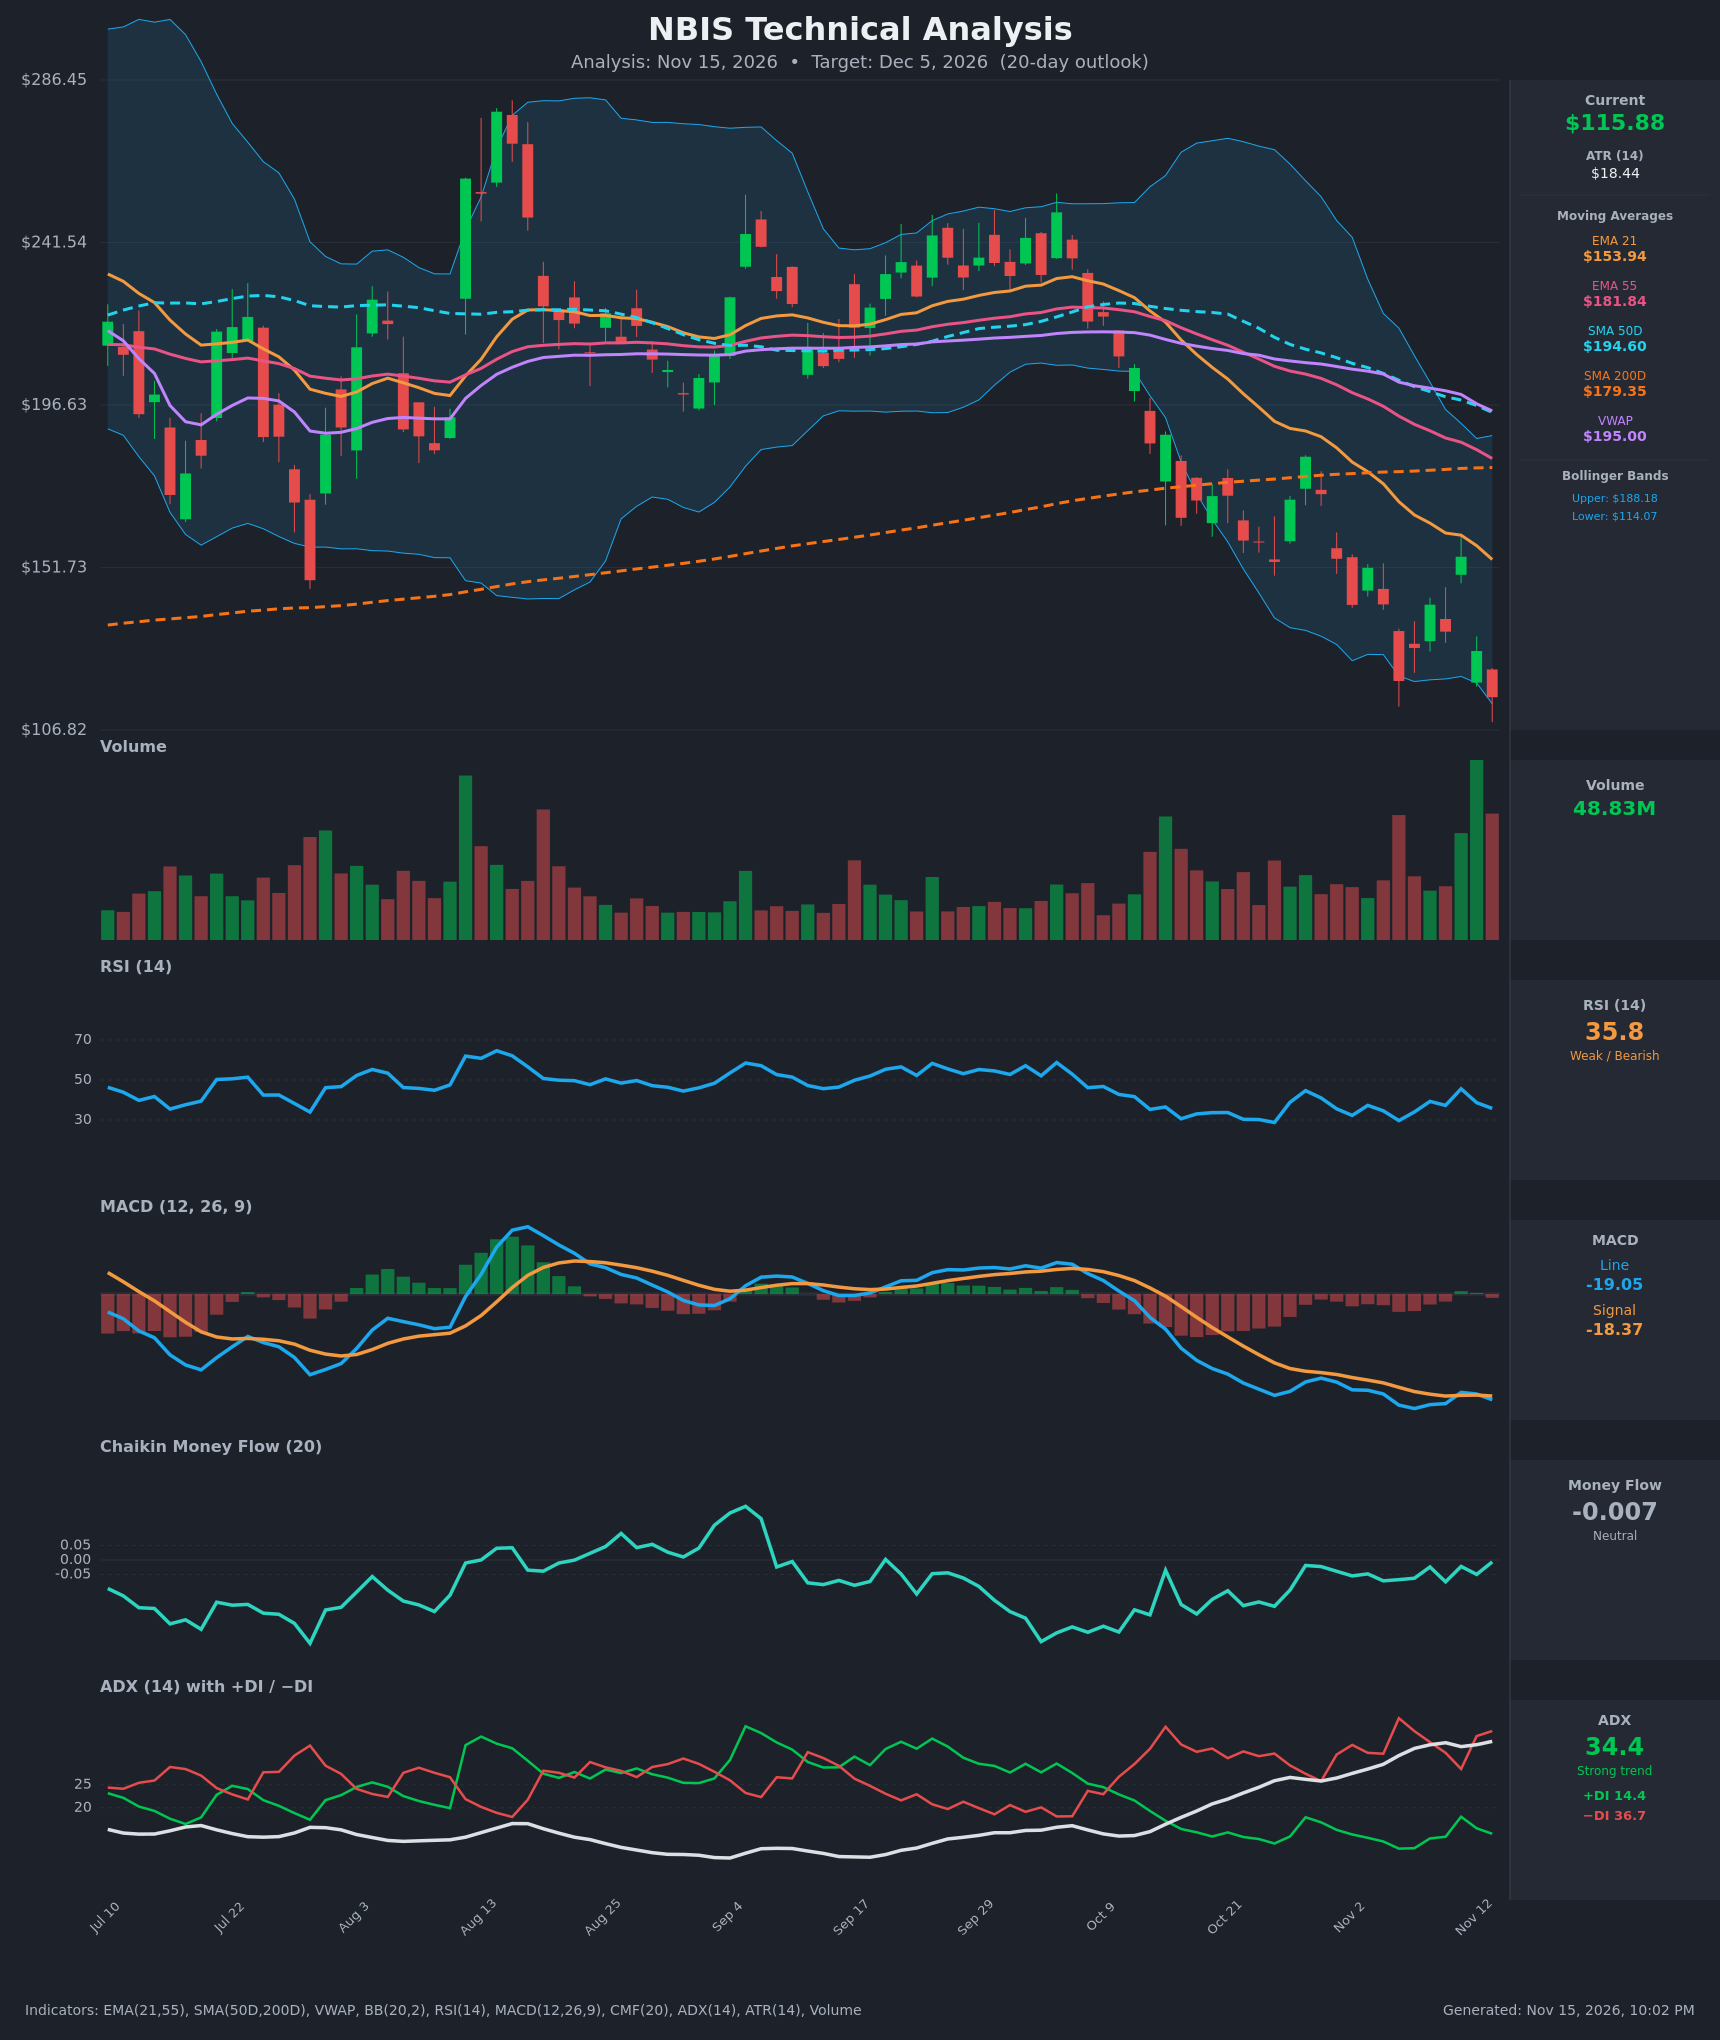
- RSI (14): 35.79, below 50 and close to oversold. Over the last 15 bars it ranged between 28.8 and 45.6 and keeps failing at lower highs (45.6 on Nov 11). It has not made a deep oversold washout, so there is room for further downside. [Bearish]
- 20 EMA: The chart plots EMA 21 at $153.94, and price at $115.88 is about 25% below it. The EMA is falling steeply (from $192 on Oct 26) and acts as heavy overhead resistance. EMA21 is also well below EMA55 ($181.84), a bearish alignment. [Bearish]
- MACD: Line -19.05 is below Signal -18.37, with a small negative histogram (about -0.68). A brief bullish cross on Nov 11 failed immediately and rolled back under the signal on Nov 12. Both lines are deeply negative and near their lows, so momentum is bearish but not accelerating sharply. [Bearish]
- Bollinger Bands (20): Upper $188.18, lower $114.07. Price sits just above the lower band, and the last candle wicked to or through it. The bands are very wide (about $74), reflecting high volatility. Riding the lower band in a strong downtrend is a continuation sign, though a snap-back toward the midline (about $151) is possible. [Bearish]
- CMF (20): -0.007, neutral (between ±0.05). It has improved from -0.16 on Oct 26, so selling pressure has eased even as price kept falling. This is a mild positive divergence but not accumulation. [Neutral]
- ADX (14): 34.4 and rising (from 25.9), with -DI at 36.7 far above +DI at 14.4. This is a strong, established downtrend with bears firmly in control. [Strong Trend – Bearish]
- Volume: 48.83M, the highest on the chart, on a red candle that closed at new lows. Heavy volume on a breakdown confirms selling. It could also be a capitulation or climax signal, but there is no confirming reversal yet. [Bearish with capitulation risk]
DIVERGENCES & TRENDS
- Price vs CMF: Price made new lows ($115.88 vs $120.37 on Nov 5) while CMF is higher (-0.007 vs -0.068). This is a mild bullish divergence that points to a possible relief bounce, but it is unconfirmed.
- Price vs RSI: RSI at 35.8 is above the 29.7 on Nov 5 while price is lower. This is a mild bullish divergence, though RSI never reached a true oversold washout.
- Moving averages:
- Price is far below the SMA200D ($179.35), VWAP ($195.00), SMA50D ($194.60), EMA21 and EMA55.
- EMA21 is already below EMA55.
- SMA50D ($194.60) is falling toward SMA200D ($179.35), which sets up a possible death cross within weeks.
- MACD: The Nov 11 bullish cross failed within a day, which confirms bearish control.
- DI: -DI has been above +DI since Oct 30, with the gap widening on the latest bar.
- Price structure: A series of lower highs and lower lows, from about $256 in early October to $115.88 now. The bounces ($182 on Oct 28, $154.69 on Nov 11) were sold into.
CHART PATTERNS
- Primary: bearish downtrend with lower highs and lower lows. The recent bounces and pullbacks resemble a Bearish Flag/Pennant continuation, with the sell-off from early October and choppy consolidation between $120 and $155 before another leg down. A measured move points lower than the $120 base.
- Possible Bearish Expanding Triangle (broadening). The swings are widening (ATR $18.4, with $20+ daily ranges). This is a volatile structure with a bearish bias when it breaks down.
- Bullish Falling Wedge possibility: Only if price reclaims $134 to $155 would a wedge or reversal structure start to develop. That is not currently confirmed.
- Death cross watch: SMA50D is converging toward SMA200D.
POTENTIAL SCENARIOS
- Scenario 1: Bearish Trend Continuation — The strong downtrend (ADX 34, -DI far above +DI) continues, with price below all major moving averages. Price grinds along or below the lower Bollinger Band. Trigger: daily close below $114 (lower BB) and the $106.82 chart low. Target: $100 to $107, with extension toward $95 possible. Invalidation: daily close above $128.64 with MACD crossing back above signal. (50% probability)
- Scenario 2: Bullish Relief Bounce — Heavy volume capitulation, mild CMF/RSI divergences and the lower-band touch spark a mean-reversion bounce toward the falling EMA21. Trigger: close above $120.37 and then $129 on rising volume. Target: $129 to $140, with $154 (EMA21) as the stretch target. Invalidation: close below $106.82. (35% probability)
- Scenario 3: Neutral Choppy Base — Price stabilizes between roughly $107 and $128 as volatility cools and the CMF stays near zero. Trigger: ADX peaking and rolling over, with several inside days. Target: $110 to $125. Invalidation: break of either $106.82 or $128.64. (15% probability)
PRICE TARGETS
- Target Price: $107.50 (20-day, about -7.2% from current)
- Expected Range: $100.50 to $113.50 (width $13.00, about 11.2% of current price, in line with the 14-21 day guidance)
- Key Levels: Support at $107.00, Resistance at $128.64
OVERALL BIAS
OVERALL BIAS: BEARISH - A strong, rising ADX (34.4) with -DI (36.7) far above +DI (14.4), price below every major moving average, a failed MACD cross, and breakdown-level volume favor continued downside. Mild CMF and RSI divergences leave a relief-bounce risk, but there is no confirmed reversal.
This is educational analysis and not financial advice.