NVDA 20-day bullish forecast — Nov 15, 2026
- Bias: Bullish
- Timeframe: 20 days (made Nov 15, 2026, target date Dec 4, 2026)
- Price at analysis: $162.85
- Price target: $170.00
- Expected range: $156.00 – $175.00
- Result: Pending — graded after the close on Dec 4, 2026
Get a free AI analysis of NVDA today
Analysis
TECHNICAL INDICATORS
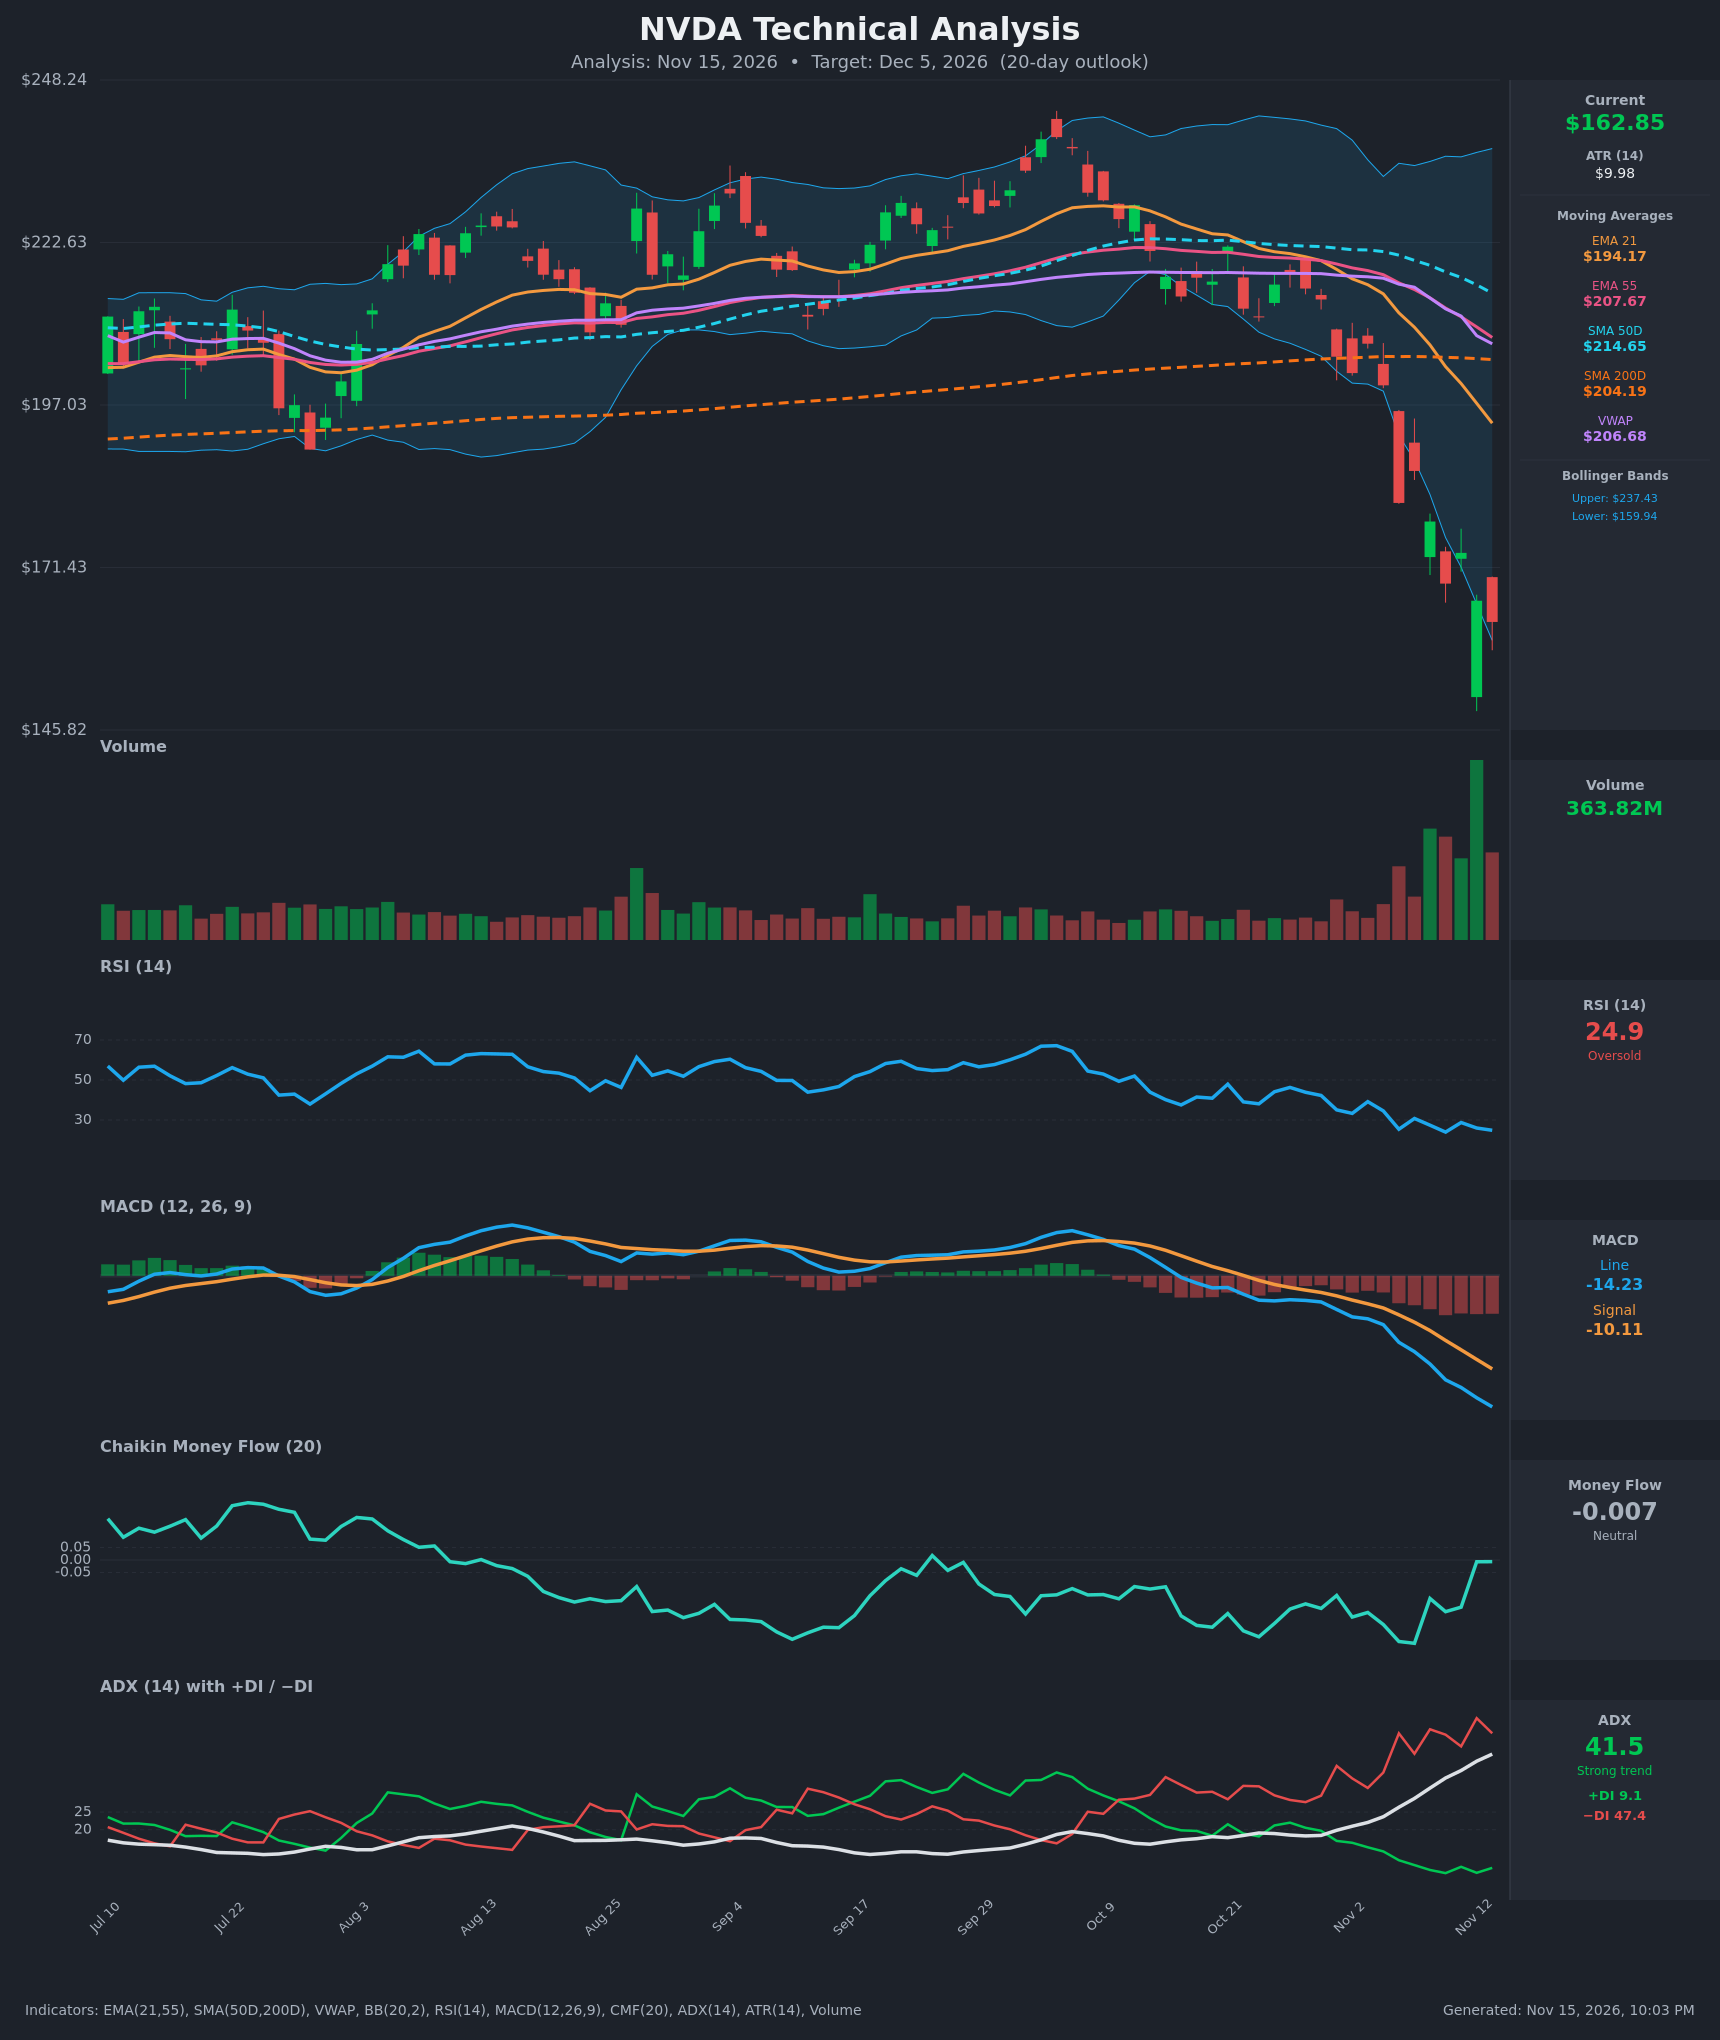
- RSI (14): 24.86, in oversold territory. It has been below 30 on most bars since Nov 5 (25.4, 30.8, 27.4, 23.9, 28.7, 26.0, 24.9). Momentum is still pointing down, but RSI made a slightly higher low (24.9 vs 23.9 on Nov 10) while price made a lower low. [Neutral]
- 20 EMA: The data gives EMA 21 at $194.17, with EMA 55 at $207.67. Price is about 16% below EMA 21, which is now sloping down sharply and acting as strong overhead resistance. EMA 21 crossed below EMA 55 around Nov 2-3, which is a bearish crossover. [Bearish]
- MACD: The line (-14.23) is below the signal (-10.11), and the gap keeps widening. The histogram is deeply negative and expanding, with no sign of a bullish turn yet. [Bearish]
- Bollinger Bands (20): Price at $162.85 sits just above the lower band ($159.94) after running along or below it for several sessions. The bands are very wide (upper $237.43), so volatility is expanded. This shows stretched downside, but a band-walk in a strong trend can persist. [Neutral]
- CMF (20): -0.007, neutral. It has recovered from -0.33 on Nov 5-6 to roughly zero while price kept falling. Selling pressure is fading. [Neutral]
- ADX (14): 41.5 and rising, with −DI (47.4) far above +DI (9.1). This is a strong, mature bearish trend, and bears have full control. Such readings often precede exhaustion, but they do not signal a reversal on their own. [Strong Trend – Bearish]
- Volume: 363.82M, the highest bar on the chart and several times the average. It came on a large flush down to about $150 intraday and a recovery to $162.85. This looks like a climactic or capitulation bar. [Capitulation / Possible Exhaustion]
DIVERGENCES & TRENDS
- Bullish divergence (RSI): Price made a lower low ($168.89 → $162.85) while RSI made a marginally higher low (23.9 → 24.9). This is modest but notable.
- Bullish divergence (CMF): CMF has risen from about -0.33 to -0.007 while price fell roughly 10%. Distribution is easing.
- Bearish trend structure:
- Price is below every moving average: EMA 21, EMA 55, SMA 50D, SMA 200D and VWAP.
- It is about 20% under the SMA 200D ($204.19).
- VWAP ($206.68) is far overhead.
- Moving-average crossovers:
- EMA 21 is below EMA 55, a bearish cross that is already confirmed.
- SMA 50D ($214.65) is still above SMA 200D, but the gap is narrowing quickly, so a death cross is a risk in the coming weeks.
- MACD: It has been in a bearish crossover since late Oct and is accelerating lower.
- DI lines: −DI has been on top since Oct 26, and +DI has collapsed to single digits. This is the typical profile of a blow-off selling phase.
- Price action: Price fell from about $216 on Oct 26 to $162.85, roughly 25% in 14 sessions, with a gap-down and a very large volume spike. The last candle shows a long lower wick, which suggests buyers are absorbing supply near $150.
CHART PATTERNS
- Bearish Head and Shoulders / Double Top (loose match): The October peak near $240 followed by lower highs, then a break of the $200-$205 support zone, resembles a distribution top. The breakdown through the neckline area (about $197-$205) has already played out. The implied measured move is largely achieved, which supports exhaustion risk.
- Bearish continuation: The late-October to early-November range of $200-$217 acted like a flag or rectangle before the break. The break accelerated the decline.
- Bullish reversal candidates: No confirmed bullish reversal pattern from the reference diagram exists yet. The long-wicked climactic volume bar is the first sign of a possible bottom. A bullish falling wedge or double bottom would need to form near $150-$165.
- Targets:
- A relief rally would likely stall at the $173-$179 gap zone, then at EMA 21 (about $194).
- A failed bounce would retest the $148-$150 intraday low.
POTENTIAL SCENARIOS
- Scenario 1: Bullish Oversold Relief Bounce — Climactic volume, a double oversold reading, RSI and CMF divergences and price at the lower Bollinger Band suggest sellers are exhausted. A mean-reversion bounce takes price back toward the gap-fill zone. Trigger: a daily close above $168.89-$173.73 with RSI back above 30 and a narrowing MACD histogram. Target: $173-$179, with an extension toward EMA 21 near $190. Invalidation: a daily close below $150. (50% probability)
- Scenario 2: Bearish Trend Continuation — ADX of 41.5, −DI dominance and an accelerating MACD show the trend is intact. A weak bounce fails at $173-$179 and price makes new lows. Trigger: a break below $159.94 and then $150 on elevated volume. Target: $140-$148. Invalidation: a daily close above $179. (38% probability)
- Scenario 3: Neutral Base Building — Price chops between $150 and $175 as volatility compresses. Trigger: tight ranges and falling volume. Target: about $160-$165. Invalidation: a close outside $148-$178. (12% probability)
PRICE TARGETS
Self-check for the 20-day timeframe:
- Range width is $175.00 − $156.00 = $19.00.
- That is 11.7% of $162.85, within the 8-12% guidance.
- The target is above the current price, consistent with the bullish bias.
- Target Price: $170.00 (20 days)
- Expected Range: $156.00 to $175.00
- Key Levels: Support at $150.00, Resistance at $178.67
OVERALL BIAS
OVERALL BIAS: BULLISH - The trend is clearly bearish, but extreme conditions favor a relief bounce over 20 days: RSI at 24.9, price at the lower Bollinger Band, a climactic volume spike, and bullish RSI and CMF divergences. Conviction is modest. The bounce is likely to face heavy resistance at $173-$194, and a close below $150 would invalidate it.
This is educational analysis and not financial advice.