SPY 20-day bearish forecast — Nov 15, 2026
- Bias: Bearish
- Timeframe: 20 days (made Nov 15, 2026, target date Dec 4, 2026)
- Price at analysis: $754.37
- Price target: $744.00
- Expected range: $716.00 – $788.00
- Result: Pending — graded after the close on Dec 4, 2026
Get a free AI analysis of SPY today
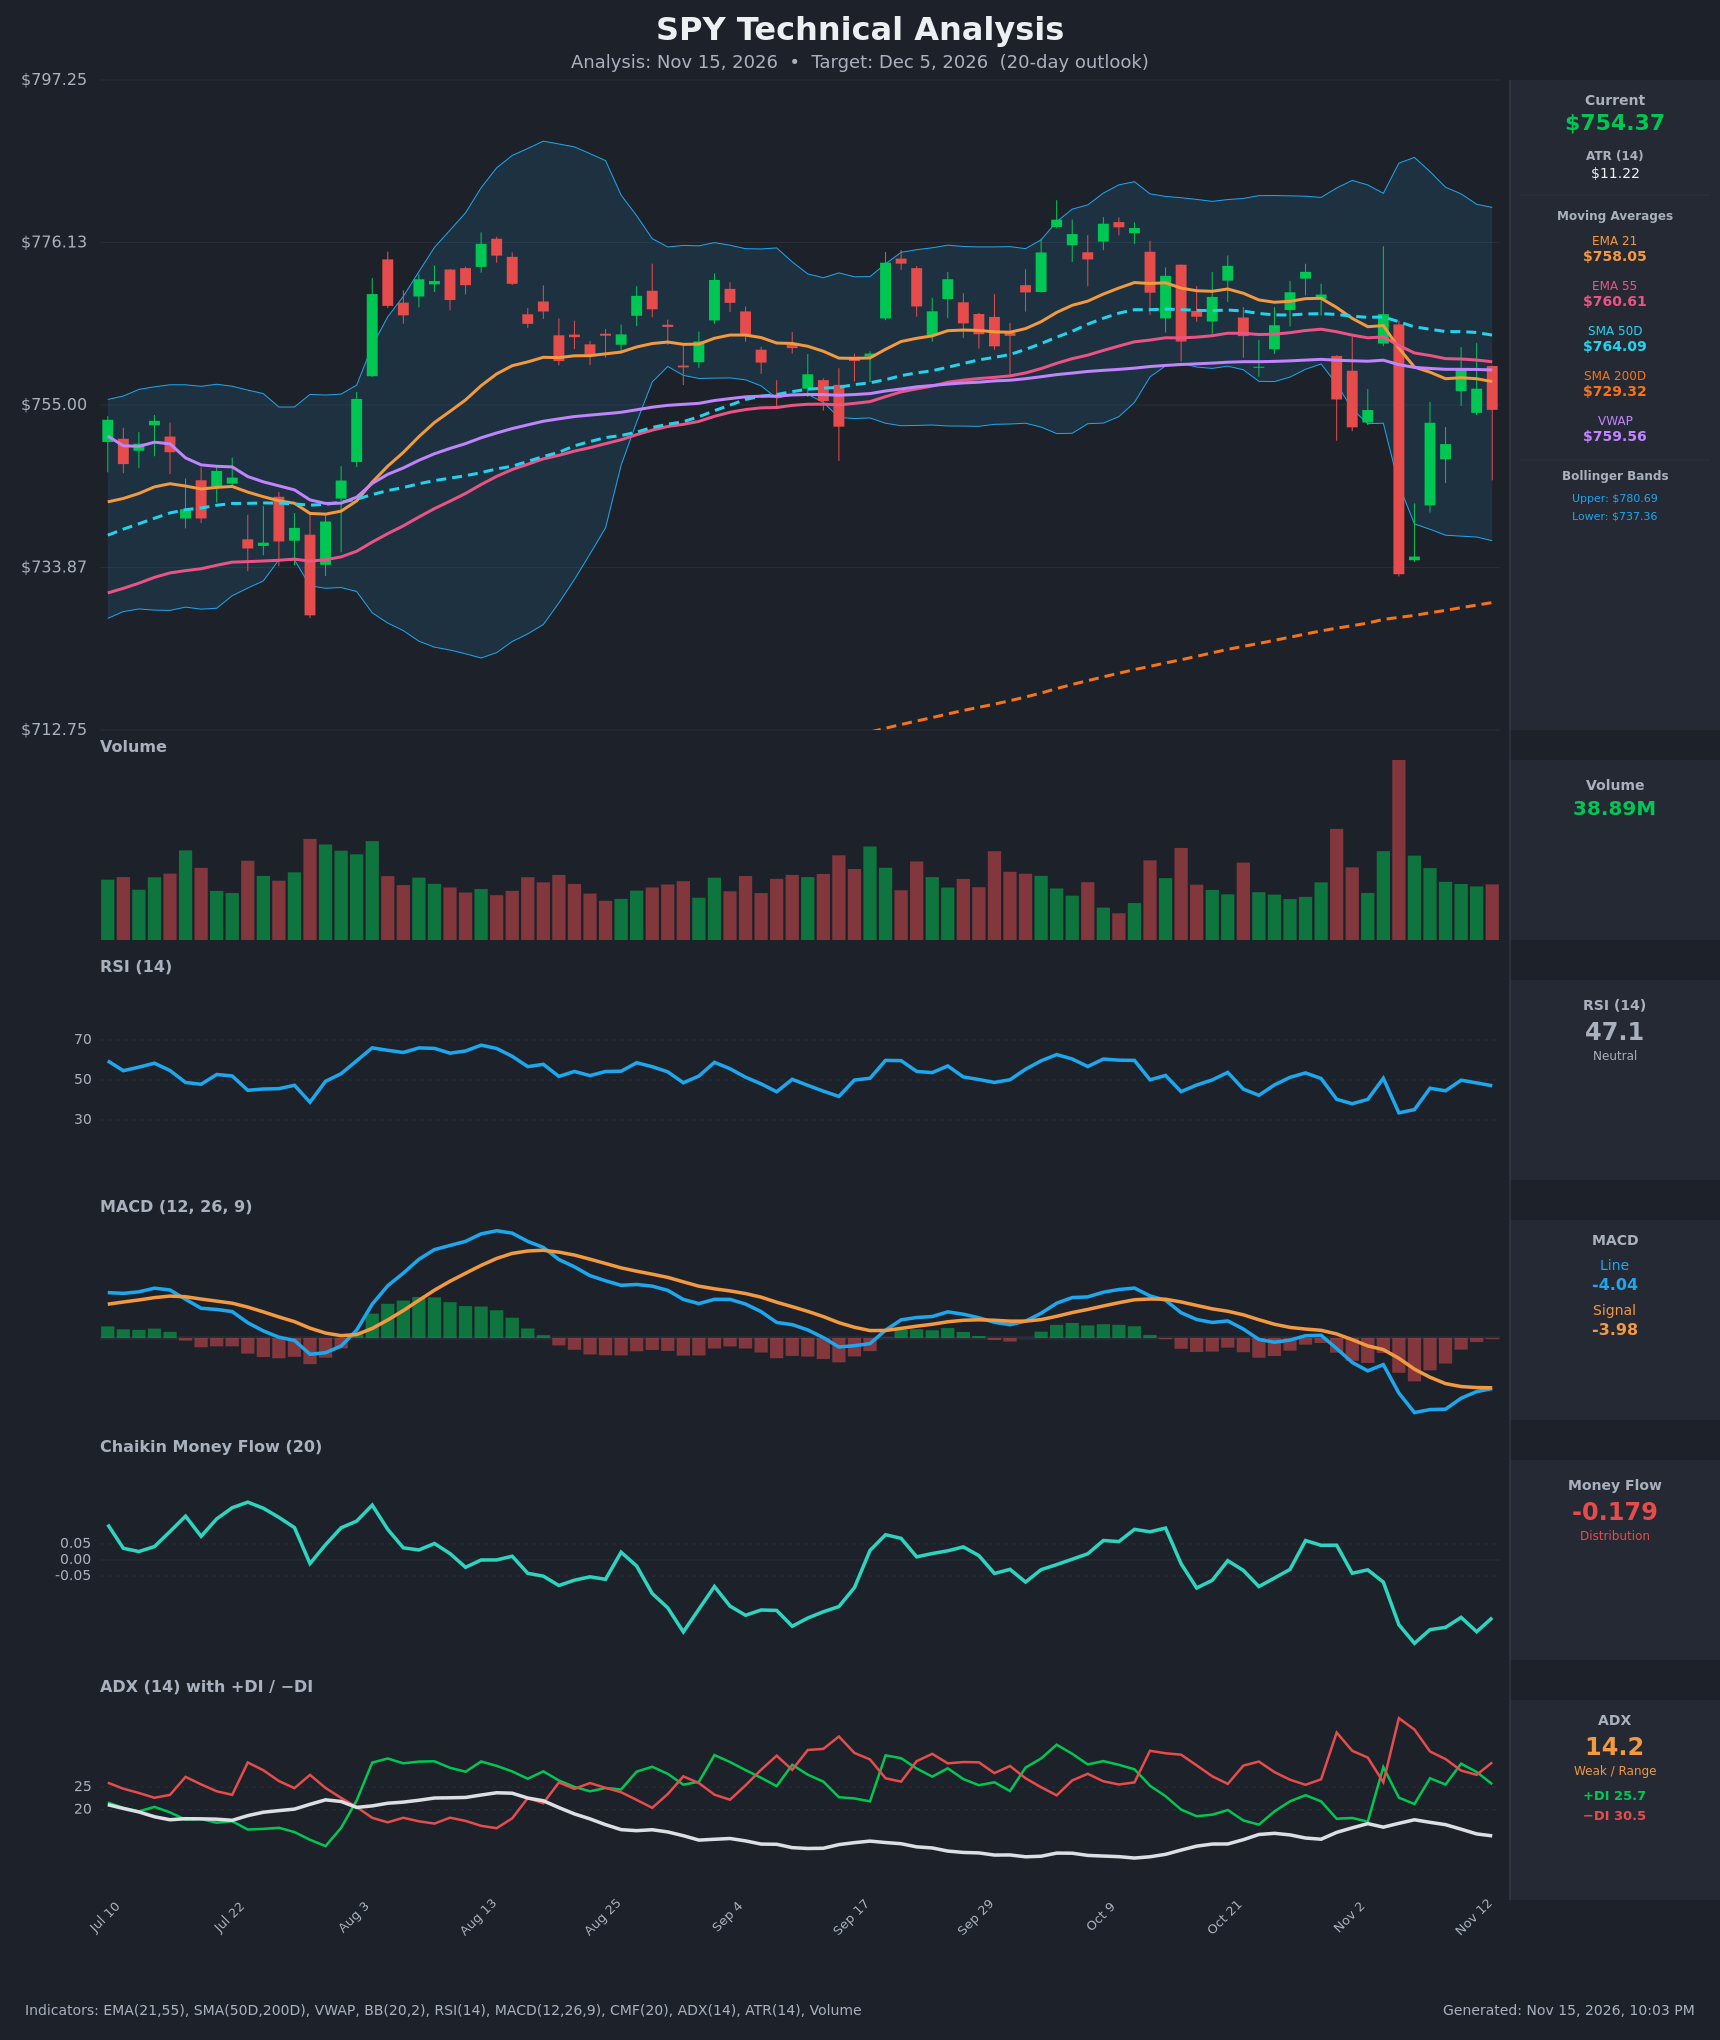
Analysis
TECHNICAL INDICATORS
- RSI (14): 47.14, just below the 50 midline. It has recovered from 33.6 on Nov 5 but has stalled in the high 40s, with no oversold bounce and no strength. [Neutral]
- 20 EMA: The 21 EMA is $758.05 and price ($754.37) is below it, so it acts as resistance. The EMA21 has been below the EMA55 ($760.61) since Nov 5, a bearish crossover, and the gap is narrowing only slightly. [Bearish]
- MACD: The line is -4.04 and the signal is -3.98, so the line is still marginally below the signal. The histogram is almost flat (about -0.06) after a steady recovery from -5.96. A bullish cross is possible within days, but the whole indicator sits below zero. [Neutral]
- Bollinger Bands (20): The bands run from $737.36 to $780.69, with a midline near $759. Price is in the lower half of the bands and below the midline, which is resistance. The Nov 5 flush ($733) pierced the lower band and was bought back. There is no squeeze or band-walk. [Neutral]
- CMF (20): -0.179, well below -0.05. It has been negative for most of the past two weeks and fell sharply during the Nov 5 selloff, with no recovery. This points to persistent selling pressure on rallies. [Distribution]
- ADX (14): 14.2, which is weak and range-bound. −DI (30.5) is above +DI (25.7), so sellers have a modest edge. Because ADX is below 20, the directional signal is low-conviction. [Weak Trend, Bearish lean]
- Volume: 38.89M, in line with the recent average. The huge-volume red bar on Nov 5 marked a high-volume breakdown or flush. Subsequent rebound volume has been lighter and unremarkable, so the recovery lacks strong buying confirmation. [Mildly Bearish]
DIVERGENCES & TRENDS
- There is no clear divergence. Price made a lower high at $759.81 on Nov 11 relative to the $772 area in late October, and RSI also made a lower high (~50), so the two agree.
- The MACD histogram has been rising for six sessions while price is flat. That is a minor momentum improvement and the main bullish counter-signal.
- Price is below the EMA21, EMA55, SMA50D ($764.09) and VWAP ($759.56). All sit between $758 and $764 and form a dense overhead resistance band.
- The SMA200D ($729.32) is still rising and sits below price, so the long-term uptrend is intact. The SMA50D remains above the SMA200D, so there is no death cross.
- The EMA21 crossed below the EMA55 on Nov 5. The DI lines remain bearish (−DI > +DI) despite a brief +DI spike on Nov 4.
- CMF is deteriorating even though the indicators of price momentum have stabilized. This suggests the bounce is not backed by accumulation.
CHART PATTERNS
- The chart shows a broad consolidation with lower highs, loosely resembling a Bearish Pennant / Descending-style range, after the sharp Nov 5 drop. Highs have stepped down from $772 to $760, while the Nov 5 low ($733) and the lower Bollinger Band act as the floor.
- A close below roughly $733–$737 would confirm a breakdown. The measured move from the range height (~$772 − $733 = $39) points to about $695–$700, but this is a stretch for 20 days, so I use the SMA200D area ($729) as the first realistic magnet.
- Confidence in the pattern is low. The weak ADX also fits a Double Bottom–style recovery attempt (Nov 5/Nov 6 lows) that would be confirmed only above ~$767.
POTENTIAL SCENARIOS
- Scenario 1: Bearish Rejection at the MA Cluster — Price keeps failing under the $758–$764 resistance band (EMA21/EMA55/VWAP/SMA50D) while CMF stays negative and −DI stays dominant. Sellers push back toward the Nov 5 low and the rising SMA200D. Trigger: rejection at $758–$764 and a close below $748. Target: $733–$740, with an extension to $729. Invalidation: a daily close above $765. (45% probability)
- Scenario 2: Bullish Reclaim and Recovery — The MACD histogram turns positive with a bullish cross, and price reclaims the EMA21/EMA55/VWAP. This extends to the upper band as the Nov 5 flush is treated as a capitulation low. Trigger: close above $764.09 on rising volume. Target: $772–$780. Invalidation: a close back below $748 after the breakout. (30% probability)
- Scenario 3: Neutral Range Chop — Weak ADX keeps price oscillating between about $735 and $765, ending near the current level. Trigger: repeated closes between $740 and $762. Target: $750–$760. Invalidation: a close beyond either $733 or $767. (25% probability)
PRICE TARGETS
- Target Price: $744.00 (20-day horizon, Dec 5, 2026)
- Expected Range: $716.00 to $788.00 (width $72, about 9.5% of the current price, consistent with the 14–21 day guidance)
- Key Levels: Support at $733.00 (Nov 5 low, near the lower Bollinger Band at $737.36 and above the SMA200D at $729.32), Resistance at $764.09 (SMA50D, above the EMA21/EMA55/VWAP cluster at $758–$761)
OVERALL BIAS
OVERALL BIAS: BEARISH - Price is below every short-term average and VWAP, CMF shows heavy distribution (-0.179), and −DI leads +DI. The weak ADX and the nearly flat MACD histogram limit conviction, so the expected drift is modest, toward $744 and the $733 support.
This is educational analysis and not financial advice.