NVDA 27-day bullish forecast — Nov 15, 2026
- Bias: Bullish
- Timeframe: 27 days (made Nov 15, 2026, target date Dec 11, 2026)
- Price at analysis: $162.85
- Price target: $171.50
- Expected range: $152.00 – $180.00
- Result: Pending — graded after the close on Dec 11, 2026
Get a free AI analysis of NVDA today
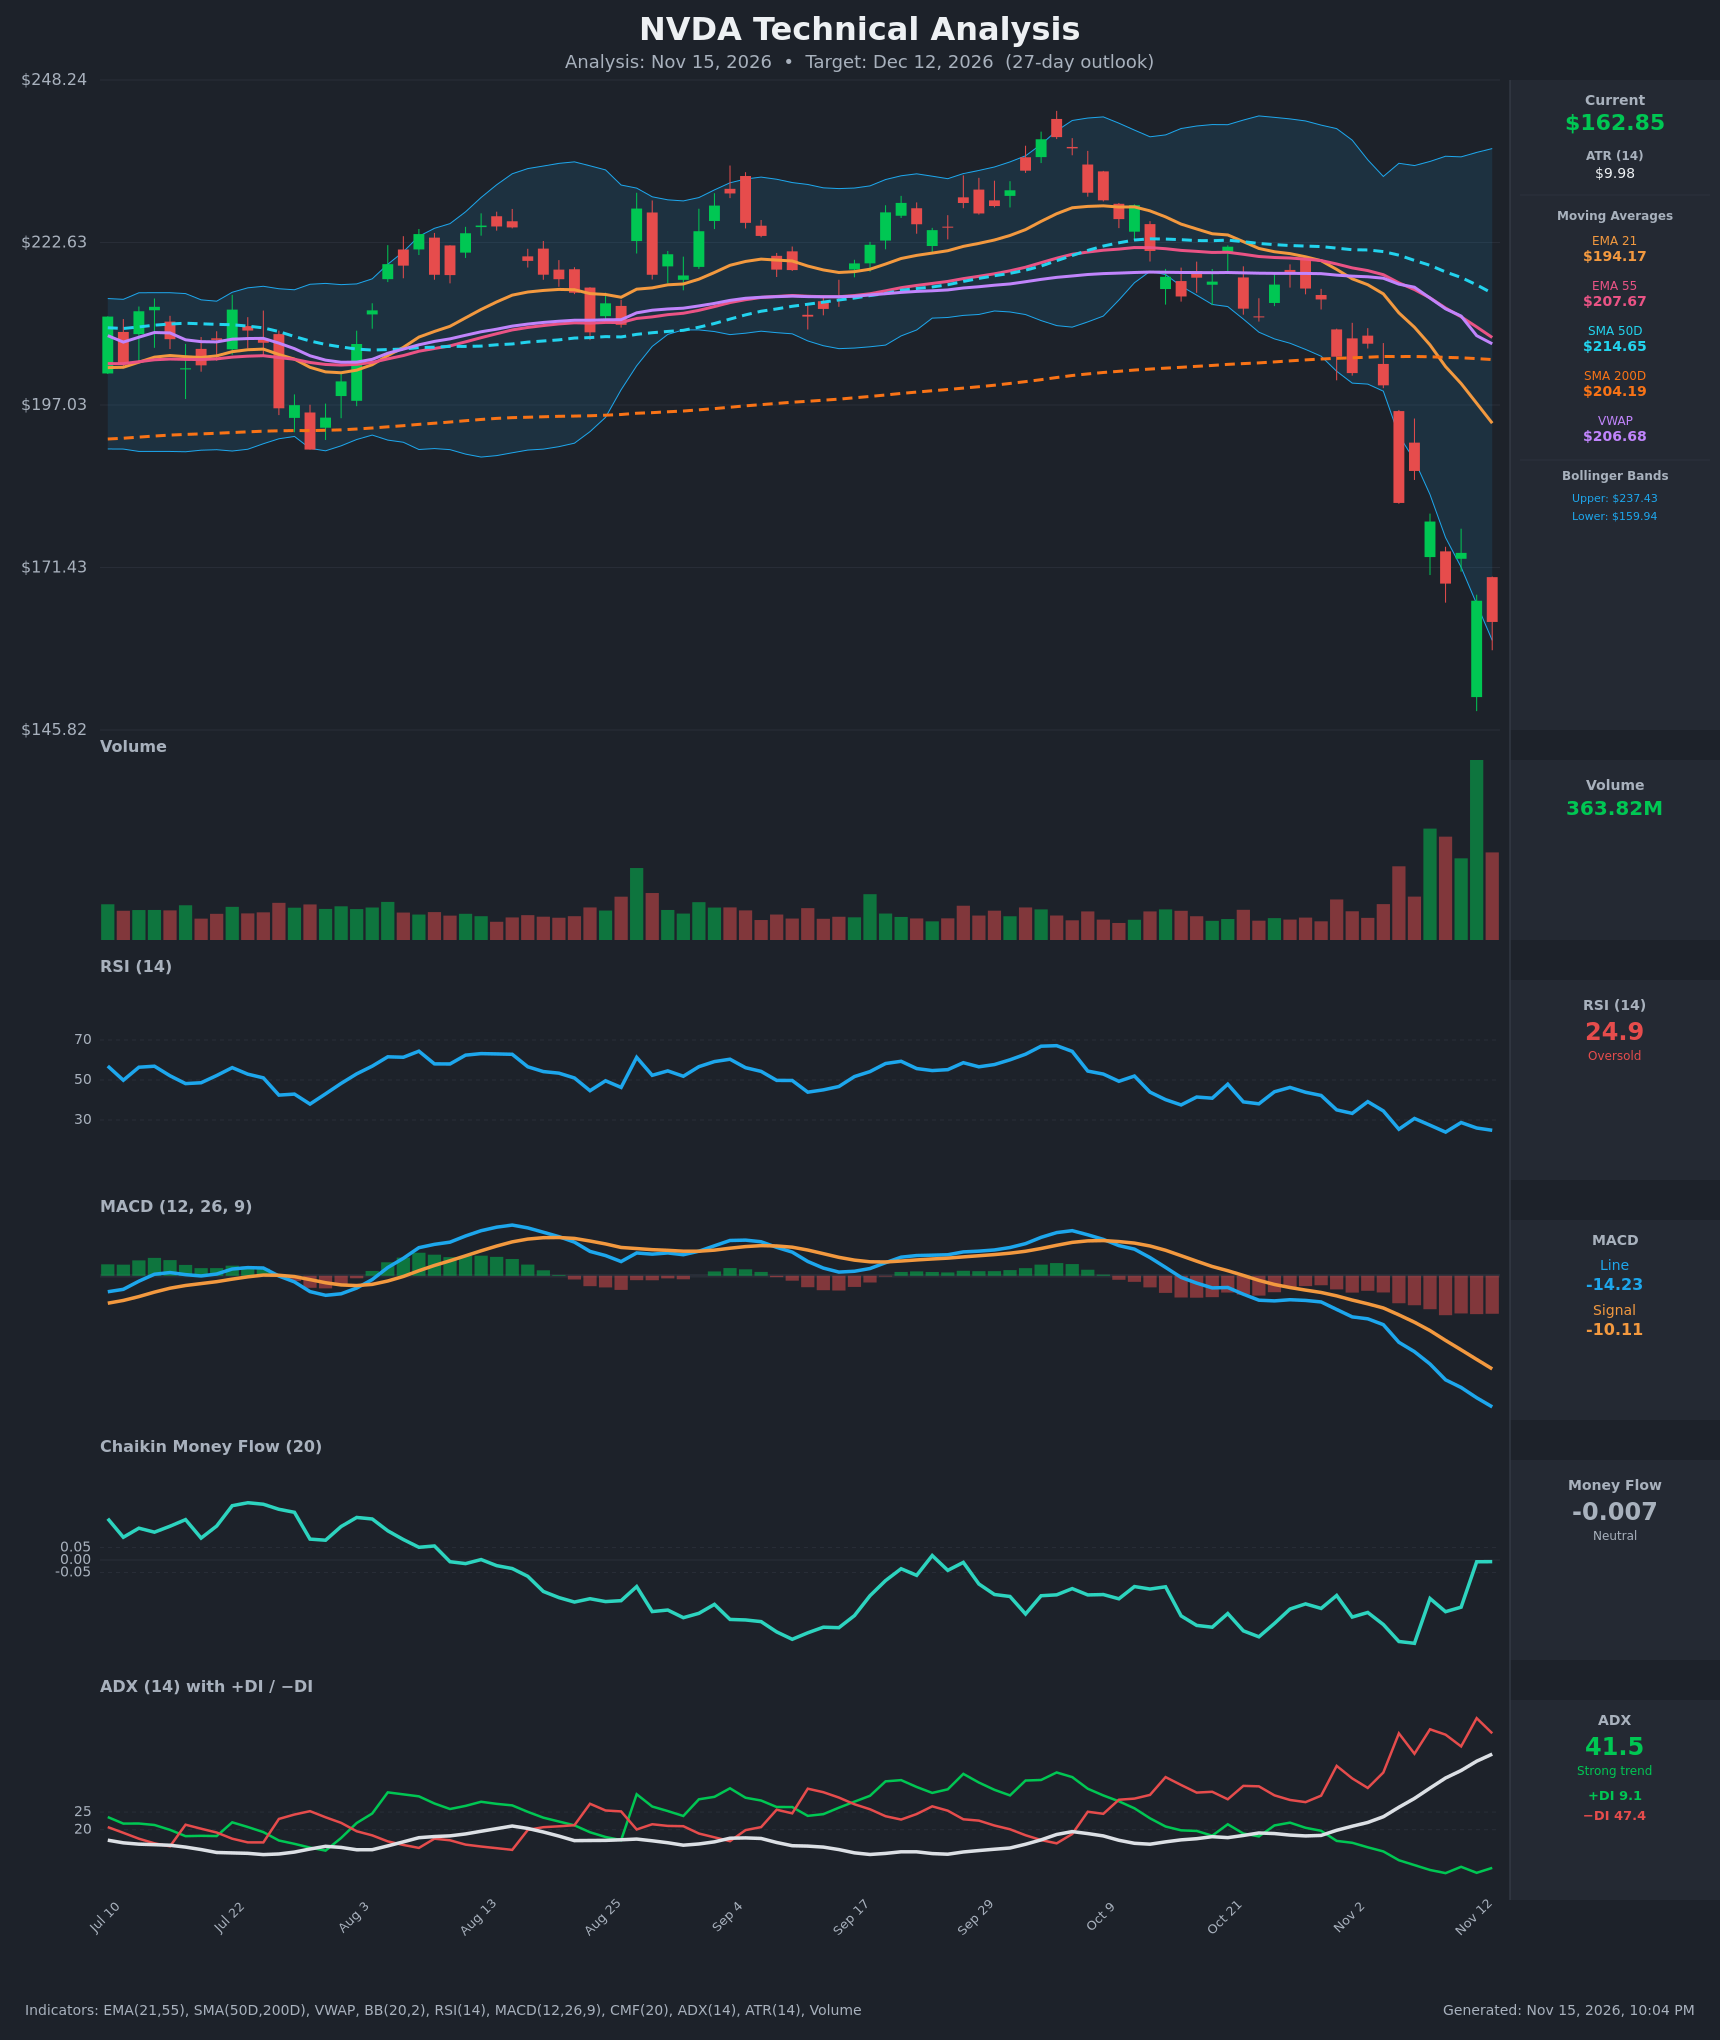
Analysis
TECHNICAL INDICATORS
- RSI (14): 24.86, in oversold territory. It touched 23.9 on Nov 10 and 25.4 on Nov 5. Price has made a lower low at $162.85 versus $168.89, but RSI is slightly higher (24.9 vs 23.9), a mild bullish divergence. Momentum is still pointing down. [Bullish]
- 20 EMA (EMA 21): $194.17, about 16% above price and falling steeply. It is now below EMA 55 ($207.67); the bearish cross occurred around Oct 29. Price is far below it, so the EMA acts as heavy overhead resistance. [Bearish]
- MACD: Line -14.23 is below signal -10.11, and both are falling. The histogram is increasingly negative (about -4.1) and the gap has widened every day. There is no sign of a bottom yet. [Bearish]
- Bollinger Bands (20): Price at $162.85 is hugging the lower band ($159.94), after the prior day's lows pierced it. The bands are wide (upper $237.43), so volatility is expanding. Closes at or below the lower band signal stretched conditions that often precede a bounce, but in strong trends price can walk the band. [Neutral]
- CMF (20): -0.007, neutral. It has climbed from about -0.33 on Nov 6 despite lower prices, so selling pressure is fading and the late-session capitulation volume was partly absorbed. [Neutral]
- ADX (14): 41.5 and rising, a strong trend. −DI (47.4) is far above +DI (9.1), so sellers are in total control. An ADX this high with an extreme −DI often means the move is mature and late-stage. [Strong Trend – Bearish]
- Volume: 363.82M, the largest bar on the chart, with other high-volume bars in the last four sessions. This looks like a climactic or capitulation selloff. It confirms the breakdown but also raises the chance of exhaustion. [Capitulation / Heavy Selling]
DIVERGENCES & TRENDS
- Bullish divergence (mild): RSI made a higher low (24.9 vs 23.9) while price made a lower low. CMF has also risen from -0.33 to about 0 while price fell.
- Trend structure:
- VWAP ($206.68), EMA 21, EMA 55, SMA 50D and SMA 200D ($204.19) are all stacked overhead.
- Price is about 20% below SMA 200D, a clear long-term break.
- SMA 50D ($214.65) is still above SMA 200D, but the gap is narrowing. A death cross is possible in the coming weeks.
- Crossovers and breaks:
- EMA 21 crossed below EMA 55 around Oct 29.
- Price lost SMA 200D on Nov 2.
- The MACD bearish cross occurred earlier in October.
- ADX rose from 19 to 41.5 in about two weeks.
- Overextension: RSI has sat at or below about 25 for several sessions, and price is more than 2 ATR below EMA 21 in a single leg.
CHART PATTERNS
- Bearish head and shoulders / double top (Aug ~$230, Oct ~$240): Price broke below the neckline around the SMA 200D area (~$200–205). The measured move (~$240 − $200 = ~$40) projects to about $160, which price has essentially reached.
- Bearish continuation risk: the vertical drop resembles a bearish pennant or flag breakdown. The pause in late Oct around $213–217 resolved lower.
- Potential relief-bounce zone: no confirmed bullish reversal pattern from the diagram yet (such as a double bottom or falling wedge). Capitulation volume at the lower band is the closest analog. Overhead supply sits at $181.60 (Nov 5 close) and $194 (EMA 21).
POTENTIAL SCENARIOS
- Scenario 1: Bullish Oversold Relief Bounce — The pattern's measured move is complete, volume was climactic, RSI is below 25, CMF is recovering, and price sits on the lower Bollinger Band. A mean-reversion rally takes price back toward the broken-support zone. Trigger: a daily close above $170–172 on stable volume. Target: $172–181, with $181.60 as the cap. Invalidation: a daily close below $148.50. (50% probability)
- Scenario 2: Bearish Trend Continuation — ADX is above 40, −DI dominates, and MACD is still widening. Price walks the lower band and breaks the capitulation low. Trigger: a close below $155, then below $148.50. Target: $135–148. Invalidation: a close above $181.60. (38% probability)
- Scenario 3: Neutral Base Building — Price chops between about $150 and $175 as the market digests the selloff. Trigger: failure to break either $148.50 or $175. Target: $155–170. Invalidation: a close outside the $148–182 range. (12% probability)
PRICE TARGETS
- Target Price: $171.50 (27-day, a relief bounce of about +5.3%)
- Expected Range: $152.00 to $180.00 (width $28 ≈ 17.2% of current price, consistent with the 30–60 day guidance; wider than any short-term range)
- Key Levels: Support at $148.50, Resistance at $181.60
OVERALL BIAS
OVERALL BIAS: BULLISH - The measured move from the topping pattern is complete, and price is deeply oversold (RSI below 25, at the lower Bollinger Band) after climactic volume. CMF and RSI are diverging positively, favoring a relief bounce toward $170–180 within 27 days. The trend is still strongly bearish (ADX 41.5, −DI dominant), so conviction is modest and a break below $148.50 invalidates the call.
This is educational analysis and not financial advice.