SPY 27-day bearish forecast — Nov 15, 2026
- Bias: Bearish
- Timeframe: 27 days (made Nov 15, 2026, target date Dec 11, 2026)
- Price at analysis: $754.37
- Price target: $743.00
- Expected range: $702.00 – $790.00
- Result: Pending — graded after the close on Dec 11, 2026
Get a free AI analysis of SPY today
Analysis
TECHNICAL INDICATORS
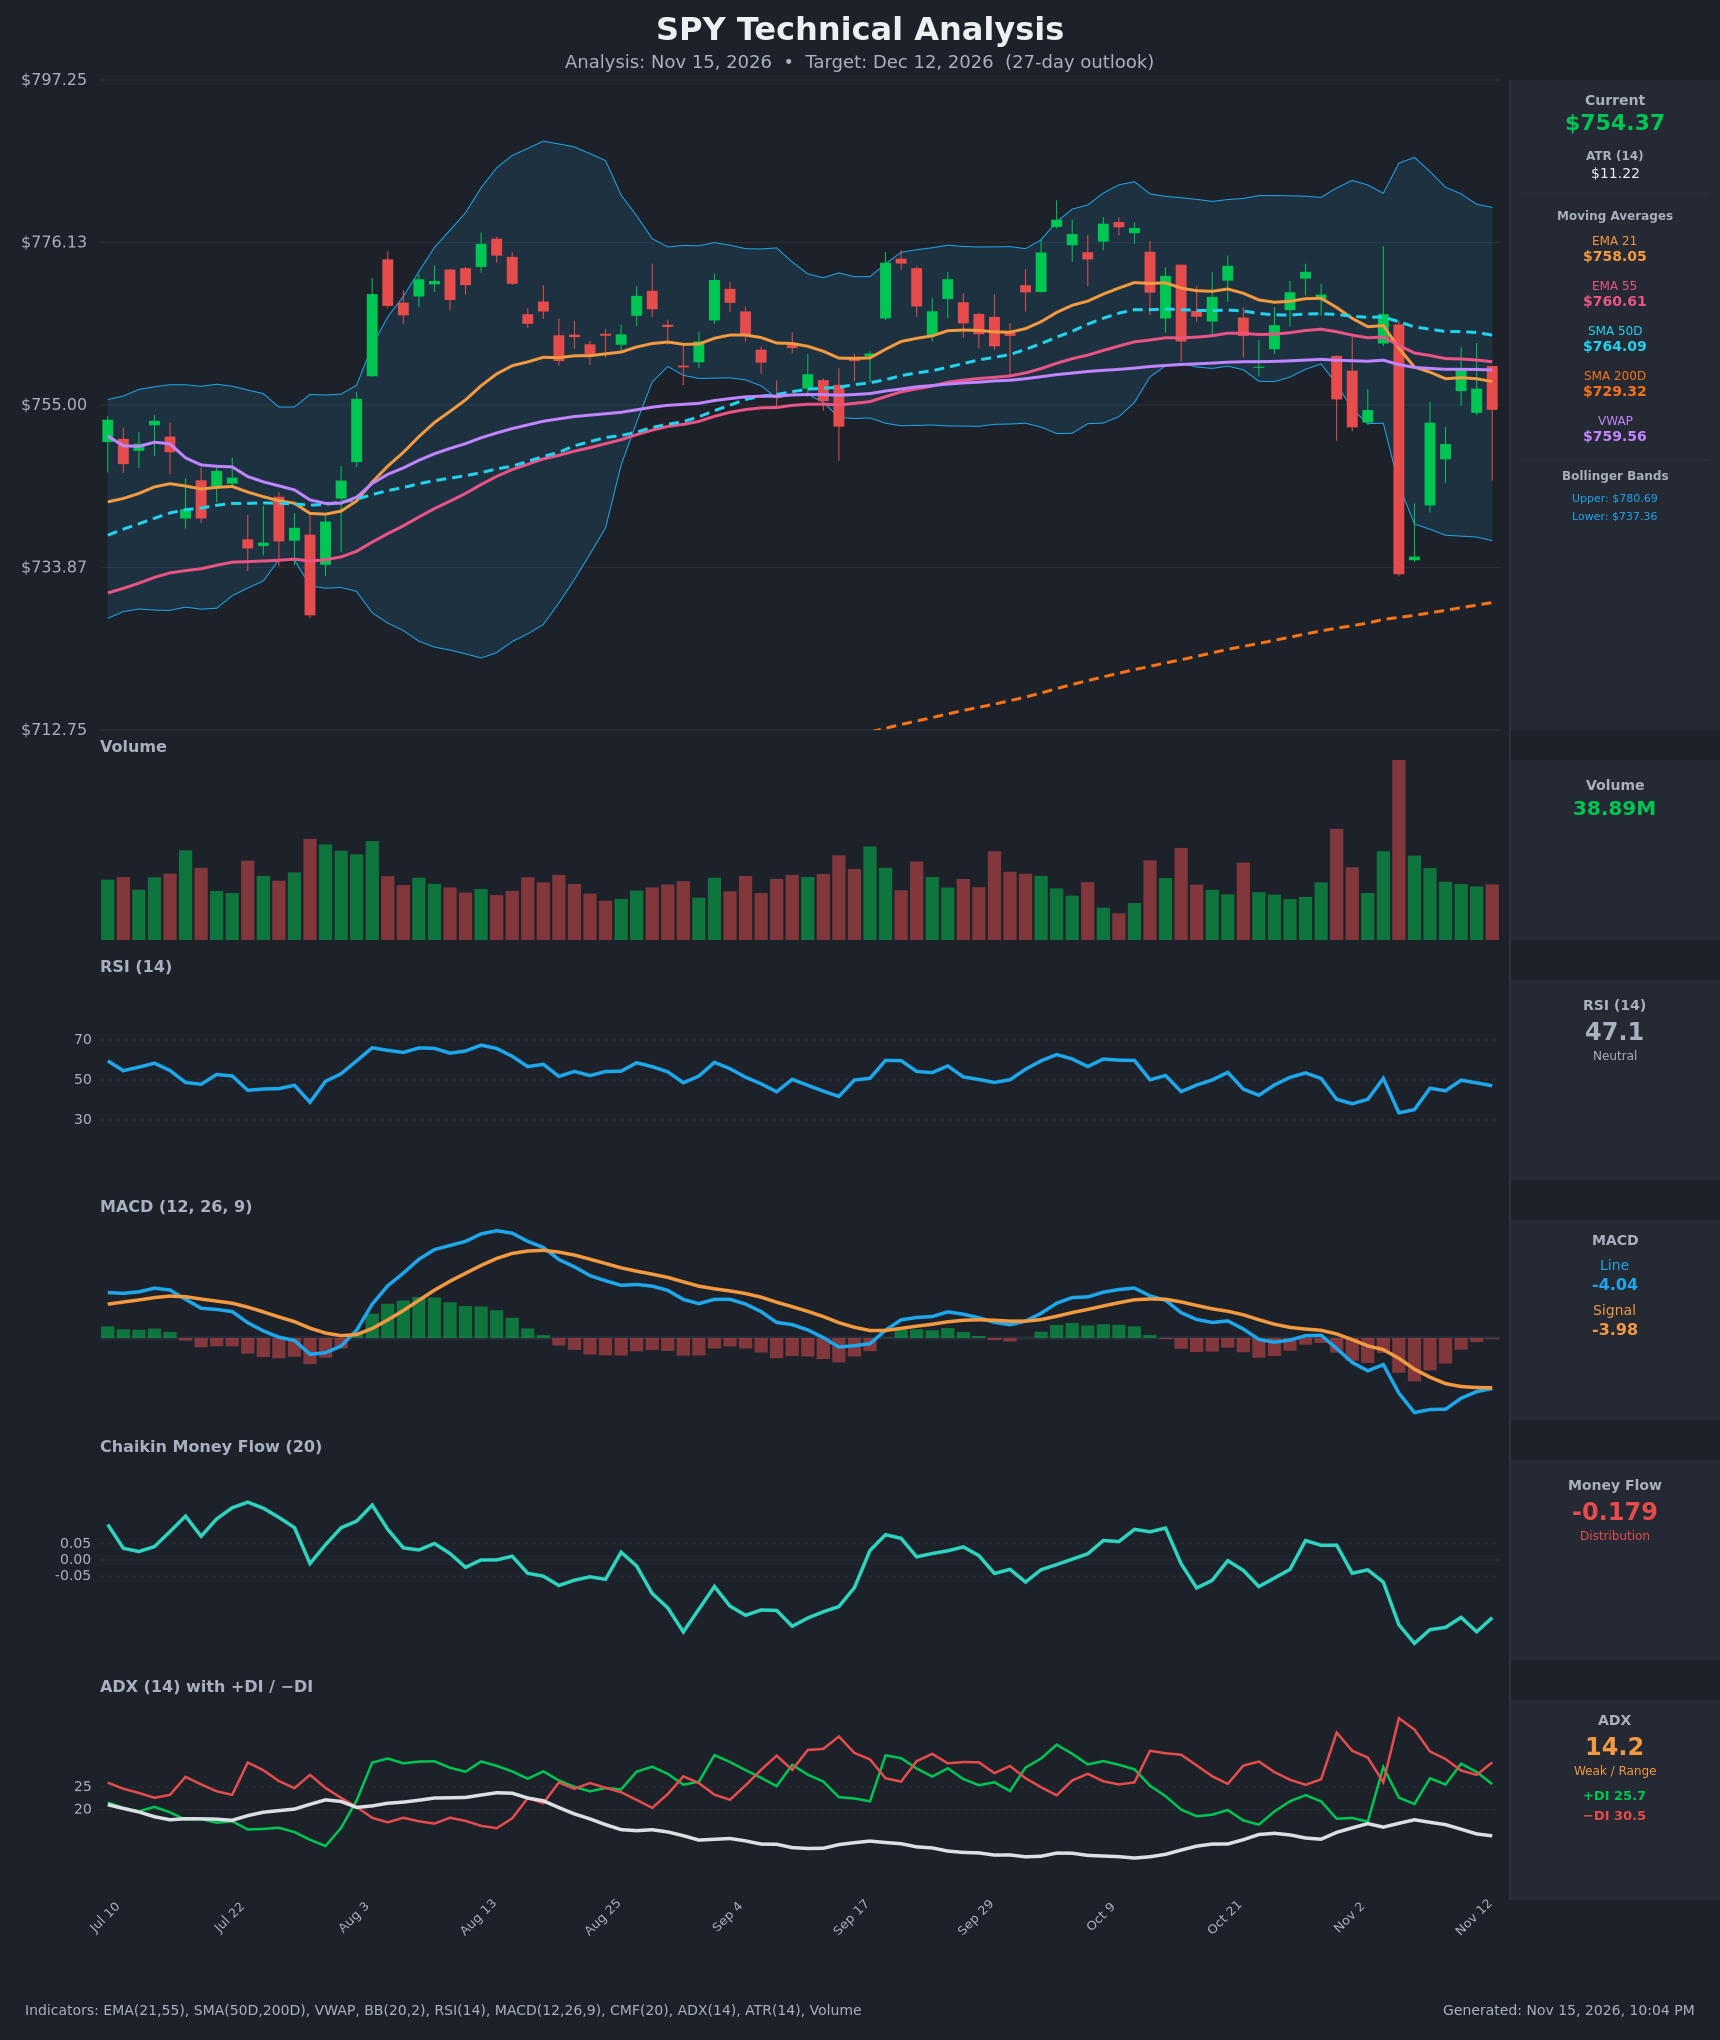
- RSI (14): 47.14, just under the 50 midline. It has chopped between 33 and 51 over the last two weeks, and the Nov 5 low at 33.6 was close to oversold before recovering. The Nov 4 and Nov 11 attempts to reclaim 50 both stalled. Momentum is flat to slightly weak, with no oversold or overbought signal. [Neutral]
- 20 EMA: The chart shows the EMA 21 at $758.05, and price ($754.37) is below it. The EMA is falling, from $768.9 on Oct 29 to $758.05. EMA 21 is also below EMA 55 ($760.61), so the short-term trend structure has rolled over. [Bearish]
- MACD: The line (-4.04) is below the signal (-3.98), so the histogram is only about -0.06. The line has risen from -5.96 on Nov 6, so downside momentum is fading and a bullish crossover is close. The reading is still negative and below zero, so it is not yet a buy signal. [Bearish]
- Bollinger Bands (20): Upper is $780.69, lower is $737.36 and the middle is about $759. Price sits slightly below the midline, in the lower half of the bands. The band width of about 5.7% is moderate. The Nov 5 close at $733 pierced the lower band and bounced sharply. A close back above the midline would be constructive, while a close below it keeps pressure on the $737 band. [Neutral]
- CMF (20): -0.179, well below -0.05. It has been negative for most of the past month and fell to about -0.26 after the Nov 5 sell-off. Selling pressure is persistent and the bounce has not been accompanied by buying. [Distribution]
- ADX (14): 14.2, which is weak and range-bound. −DI (30.5) is above +DI (25.7), so bears have the edge, but the gap is narrow and the ADX is declining. This points to a directionless drift with a slight bearish tilt rather than a strong downtrend. [Weak Trend, bearish lean]
- Volume: 38.89M, roughly average. The Nov 5 sell-off came on the largest volume spike on the chart, which indicates real distribution. The recent rebound days show only average volume, so the bounce lacks conviction. [Mildly Bearish]
DIVERGENCES & TRENDS
- Bearish trend signals:
- Price is below the EMA 21 ($758.05), EMA 55 ($760.61), SMA 50D ($764.09) and VWAP ($759.56).
- The EMA 21 crossed below the EMA 55 around Nov 5.
- Price made lower highs, from $772 on Oct 28 to $767 on Nov 4 and $760 on Nov 11.
- MACD crossed below its signal on Oct 30 and has stayed negative.
- CMF is in distribution and −DI leads +DI.
- Bullish offsets:
- The SMA 200D ($729.32) is still rising and sits just below the Nov 5 low, so the long-term trend is intact.
- MACD momentum is improving, with the line gaining on the signal from -5.96 to -4.04.
- RSI made a higher low (35 → 45 → 47) after the Nov 5 flush.
- Divergence: CMF is making lower lows while price has bounced off $733, so the bounce is not backed by money flow. This is a mild bearish divergence. There is no classic RSI divergence.
- Crossovers:
- There is no golden or death cross. SMA 50D ($764.09) is well above SMA 200D ($729.32), which is a long-term bullish alignment.
- A MACD bullish crossover looks imminent but is not confirmed.
CHART PATTERNS
- Price is in a broad range of roughly $733 to $772 and is trending toward the lower half of it. The sequence of lower highs against a firm floor at $733 to $737 loosely resembles a Descending Triangle, a bearish continuation pattern. It is not confirmed, because the ADX is weak and only the $733 spike low has been tested.
- The Nov 5 flush and rebound shows a long lower wick and partial recovery. This is not a clean Double Bottom, since there is no second matching low.
- Targets:
- A close below $733 would project the range height (about $772 minus $733, or $39) down to roughly $695 to $700. The SMA 200D at $729 is the first real support there.
- A rebound above the $760 to $764 cluster would invalidate the bearish lean and open $772 to $780.
POTENTIAL SCENARIOS
- Scenario 1: Bearish Grind Lower / Support Retest — Price stays capped under the EMA 21/55 and VWAP cluster. Persistent distribution and −DI dominance pull it back to the $733 to $740 zone and the SMA 200D. Trigger: rejection at $758 to $761 and a close below $750. Target: $735 to $745, with extension to $720 to $730 if $733 breaks. Invalidation: a daily close above $764 (SMA 50D) with CMF turning positive. (50% probability)
- Scenario 2: Bullish Reclaim and Range Rotation — The MACD bullish crossover materializes and buyers defend the rising SMA 200D area. Price reclaims the moving-average cluster and rotates back to the top of the range. Trigger: close above $761 on rising volume, with RSI above 55. Target: $772 to $780 (upper Bollinger Band). Invalidation: close back below $750 or a break below $733. (35% probability)
- Scenario 3: Neutral Range Chop — A weak ADX keeps price oscillating around the $759 midline and VWAP. It ends the period near current levels. Trigger: repeated closes between $745 and $762. Target: $750 to $760. Invalidation: a close beyond $733 or $772. (15% probability)
PRICE TARGETS
- Target Price: $743.00 (27-day horizon, Dec 12, 2026)
- Expected Range: $702.00 to $790.00 (width $88, about 11.7% of the current price, consistent with the 27-day timeframe guidance)
- Key Levels: Support at $733.00 (Nov 5 low, just above the SMA 200D at $729.32), Resistance at $760.61 (EMA 55, with VWAP near $759.56)
OVERALL BIAS
OVERALL BIAS: BEARISH - Price is below all the short-term moving averages and VWAP, CMF shows persistent distribution, and −DI leads +DI with lower highs forming. The rising SMA 200D and fading MACD downside momentum limit the downside, so the expected move is a modest drift toward $733 to $745 rather than a collapse.
This is educational analysis and not financial advice.