SPY 34-day bearish forecast — Nov 15, 2026
- Bias: Bearish
- Timeframe: 34 days (made Nov 15, 2026, target date Dec 18, 2026)
- Price at analysis: $754.37
- Price target: $744.00
- Expected range: $702.00 – $795.00
- Result: Pending — graded after the close on Dec 18, 2026
Get a free AI analysis of SPY today
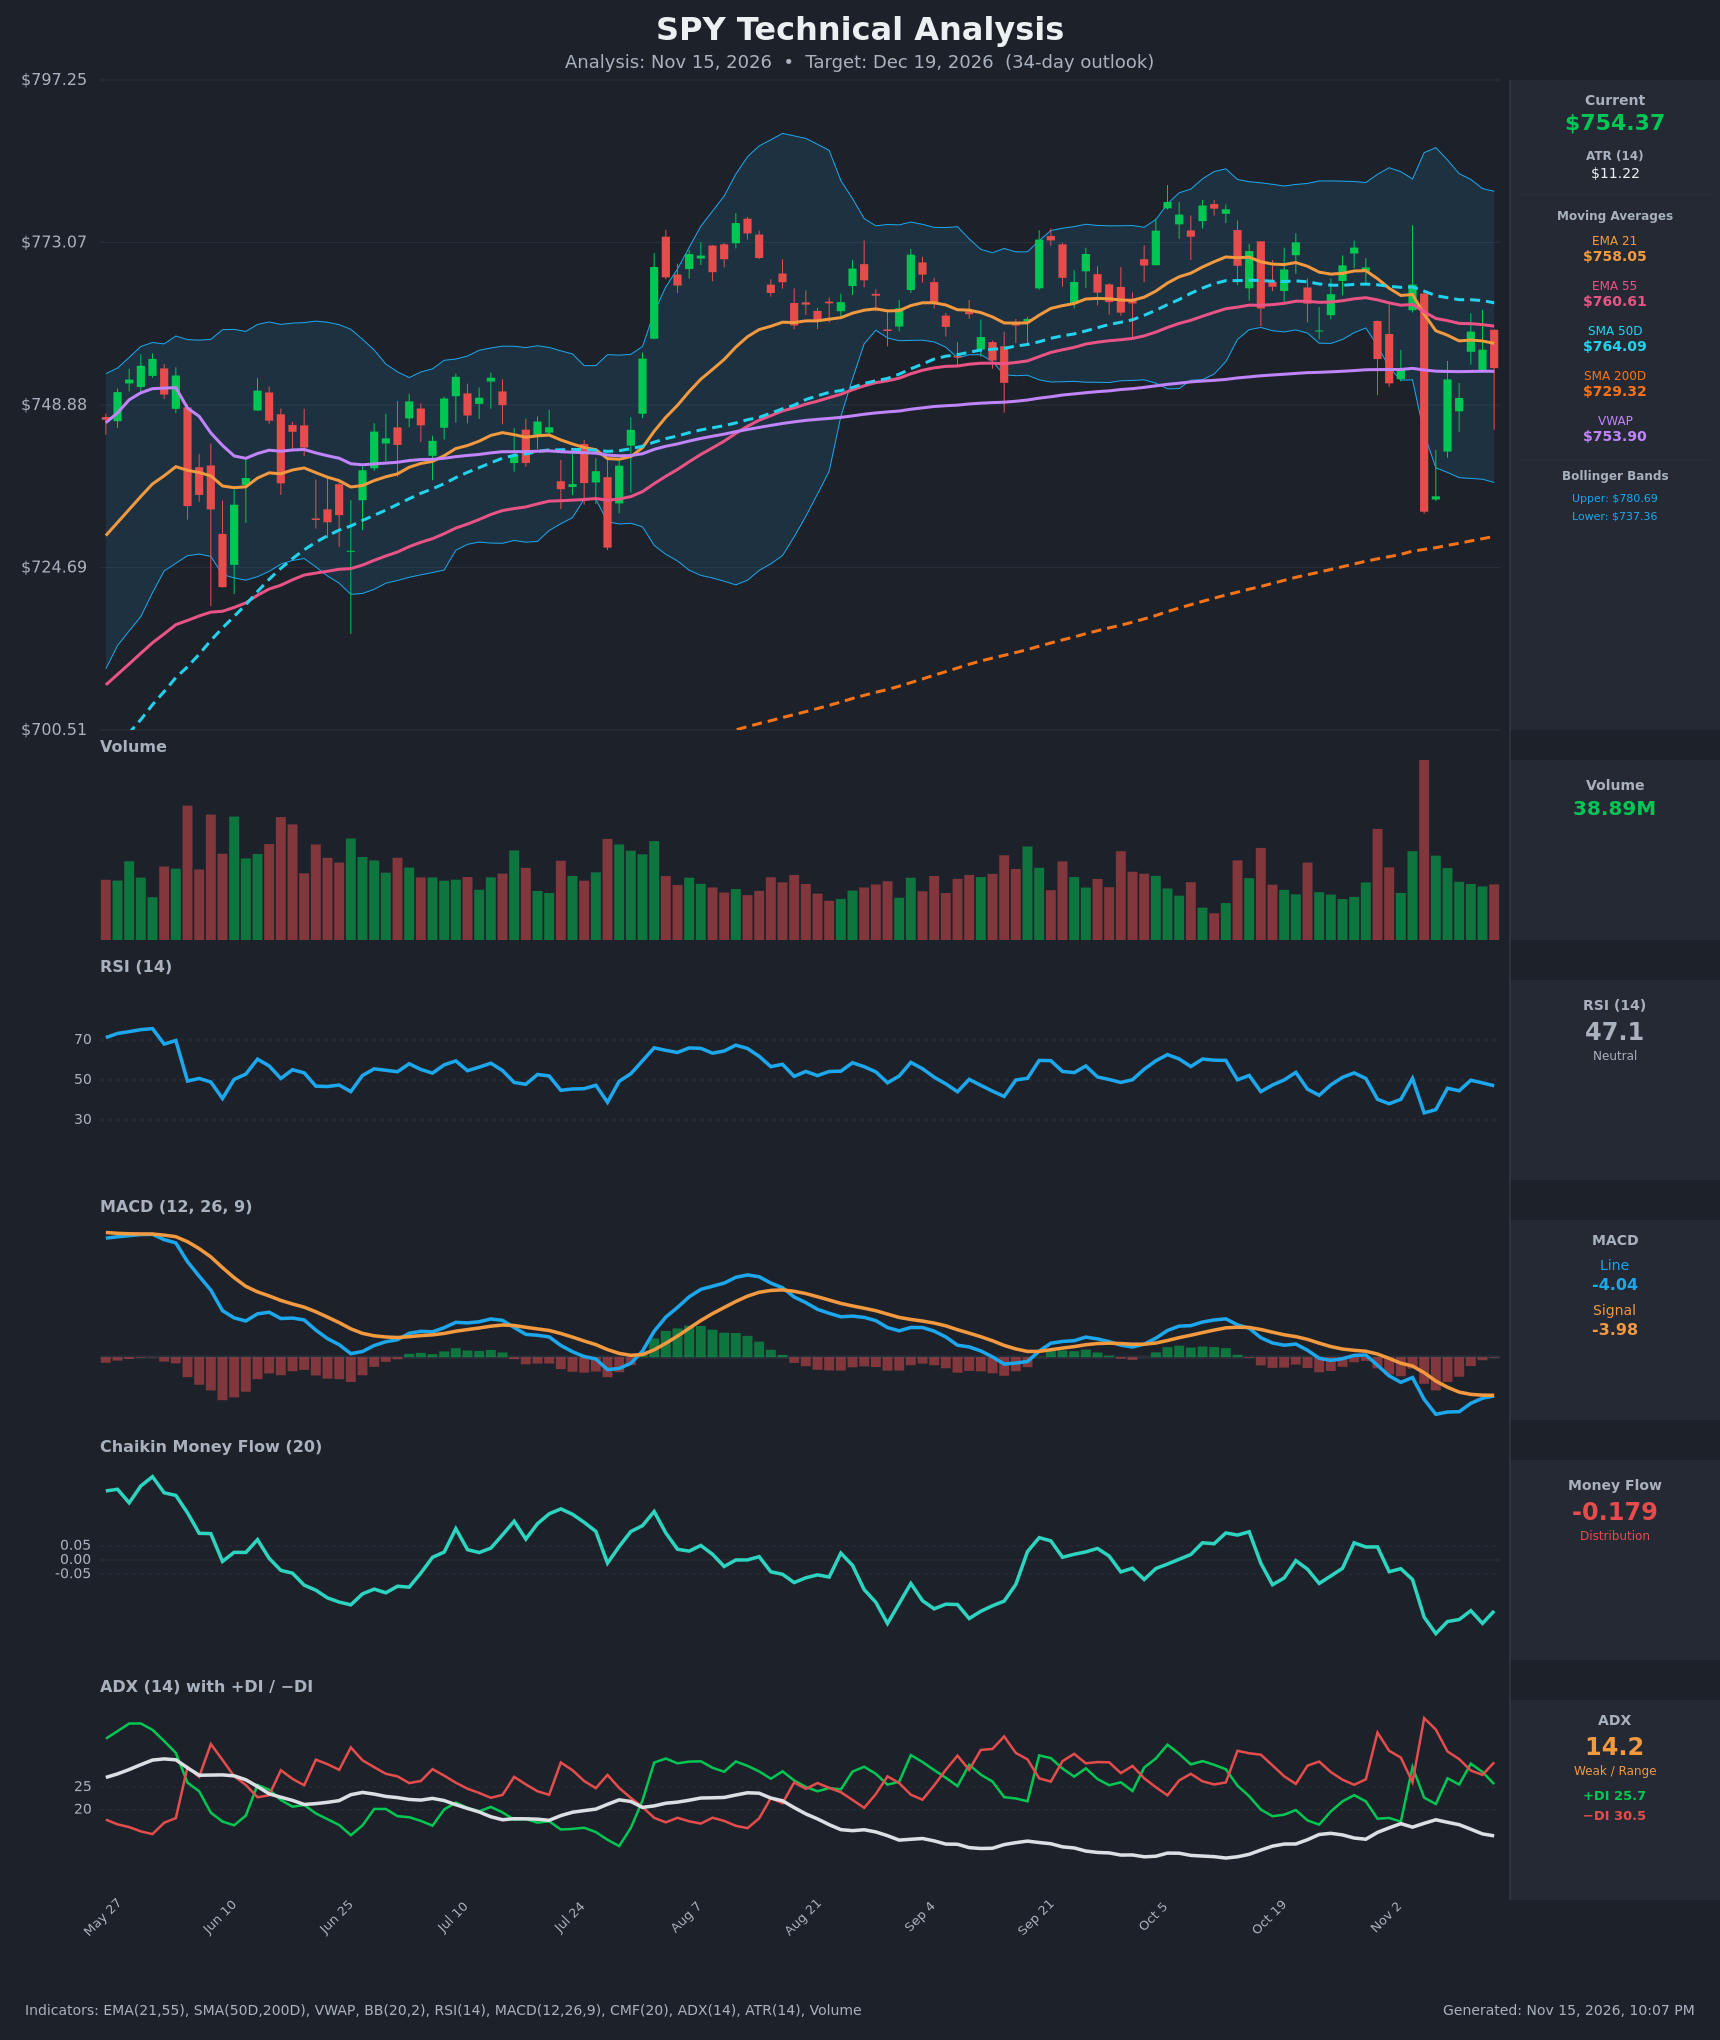
Analysis
TECHNICAL INDICATORS
- RSI (14): 47.14, just under the 50 midline. It dropped to 33.6 on Nov 5 and recovered into the high 40s, then stalled (49.9 → 48.6 → 47.1). Momentum is neutral and fading slightly on the latest bars. [Neutral]
- 20 EMA (EMA 21): $758.05, with price at $754.37 below it. EMA21 crossed below EMA55 ($760.61) around Nov 5 and both are sloping down. The EMAs now act as overhead resistance. [Bearish]
- MACD: Line -4.04, signal -3.98, so the line is just below the signal and both are below zero. The histogram has shrunk from its Nov 6 extreme (-5.96 vs -2.49) to roughly -0.06. Selling momentum is exhausting, but there is no bullish cross yet and the bearish zero-line position stands. [Bearish]
- Bollinger Bands (20): Upper $780.69, lower $737.36, middle about $759. Price sits in the lower half of the bands, below the midline, and the bands are fairly wide after the Nov 5 flush. There is no squeeze or band-walk. [Neutral]
- CMF (20): -0.179, well below the -0.05 threshold. It has been negative for most of the last 10 bars and bottomed near -0.26. This is persistent distribution even as price bounces. [Distribution]
- ADX (14): 14.2, weak and drifting lower, with -DI (30.5) above +DI (25.7). Bears hold slight control but there is no real trend. The market is range-like with a mild downward lean. [Weak Trend, bearish lean]
- Volume: 38.89M, around average. The largest volume spike came on the Nov 5 breakdown candle (down day), and volume on the rebound bars has been modest. Selling was heavier than buying on the way down. [Mildly bearish]
Other context:
- Price is below SMA50 ($764.09) and EMA55, and slightly above VWAP ($753.90), which acts as a pivot.
- Price is well above SMA200 ($729.32), so the long-term uptrend is intact. SMA50 is above SMA200, with no death cross.
DIVERGENCES & TRENDS
- Price vs CMF: Price bounced from $733 to $754 but CMF stayed deeply negative (-0.18). That is bearish divergence, since the rebound lacks buying pressure.
- MACD histogram: It is converging toward zero while price is flat, an early bullish momentum-exhaustion sign. A true bullish cross would need price to hold above $754–$758.
- Lower highs: Swing highs went from $772 to $767 to $760, and the EMAs are rolling over.
- Crossovers: EMA21 crossed below EMA55 on Nov 5 (bearish). MACD has been below its signal since Oct 30. −DI is back above +DI.
- RSI: It is range-bound between 33 and 53 over the last month, with no oversold signal.
CHART PATTERNS
- Bearish Flag / Pennant (weak match): After the sharp Nov 5 drop, price formed a small rebound that is failing beneath the declining EMA21/55. A rollover would measure toward the $733 low and the SMA200 zone around $729.
- Wide range structure: Price has traded roughly $733–$772 for months, similar to a Triple Top / range base. The $733–$737 area is key support. A break would turn the structure into a reversal.
- Bullish counter-reading: A reclaim of $764 (SMA50) would negate the flag reading. It would turn the Nov 5 drop into a failed breakdown and point back toward the $772–$780 range highs.
- There is no high-confidence classic pattern. The lean is a mild bearish continuation within a larger range.
POTENTIAL SCENARIOS
- Scenario 1: Bearish Drift Toward Range Support — Distribution (CMF -0.18), −DI dominance and rejection at EMA21/55 push price back to retest the Nov 5 low and lower Bollinger Band. Trigger: failure at $758–$761 and a close below $750 and VWAP ($753.90). Target: $737 first, then $730–$733 (SMA200 area). Invalidation: daily close above $764 (SMA50). (45% probability)
- Scenario 2: Bullish Reclaim and Recovery — The MACD histogram turns up, price reclaims the EMAs and SMA50, and the long-term uptrend above SMA200 reasserts itself. Trigger: close above $761 with CMF turning back above 0. Target: $772–$780 (upper Bollinger Band and prior highs). Invalidation: close below $737. (35% probability)
- Scenario 3: Neutral Chop — Weak ADX keeps price between $737 and $762 around VWAP. Trigger: failed breaks on both sides. Target: $745–$758. Invalidation: close outside $733–$765. (20% probability)
PRICE TARGETS
- Target Price: $744.00 (34-day, about -1.4% from current)
- Expected Range: $702.00 to $795.00 (width $93, about 12.3% of current price, consistent with the 30–60 day guidance)
- Key Levels: Support at $737.36 (lower Bollinger Band; secondary $733 low and $729.32 SMA200), Resistance at $758.05 (EMA21; next $760.61 EMA55 and $764.09 SMA50)
OVERALL BIAS
OVERALL BIAS: BEARISH - Price is below the EMA21, EMA55 and SMA50. EMA21 has crossed under EMA55, MACD is negative, CMF shows persistent distribution (-0.18) and −DI is above +DI. The bias is modest because ADX is weak and price remains above the rising SMA200, so downside is likely limited to the $730–$737 support zone.
This is educational analysis and not financial advice.