SPY 48-day bearish forecast — Nov 15, 2026
- Bias: Bearish
- Timeframe: 48 days (made Nov 15, 2026, target date Jan 1, 2027)
- Price at analysis: $754.37
- Price target: $741.00
- Expected range: $702.00 – $795.00
- Result: Pending — graded after the close on Jan 1, 2027
Get a free AI analysis of SPY today
Analysis
TECHNICAL INDICATORS
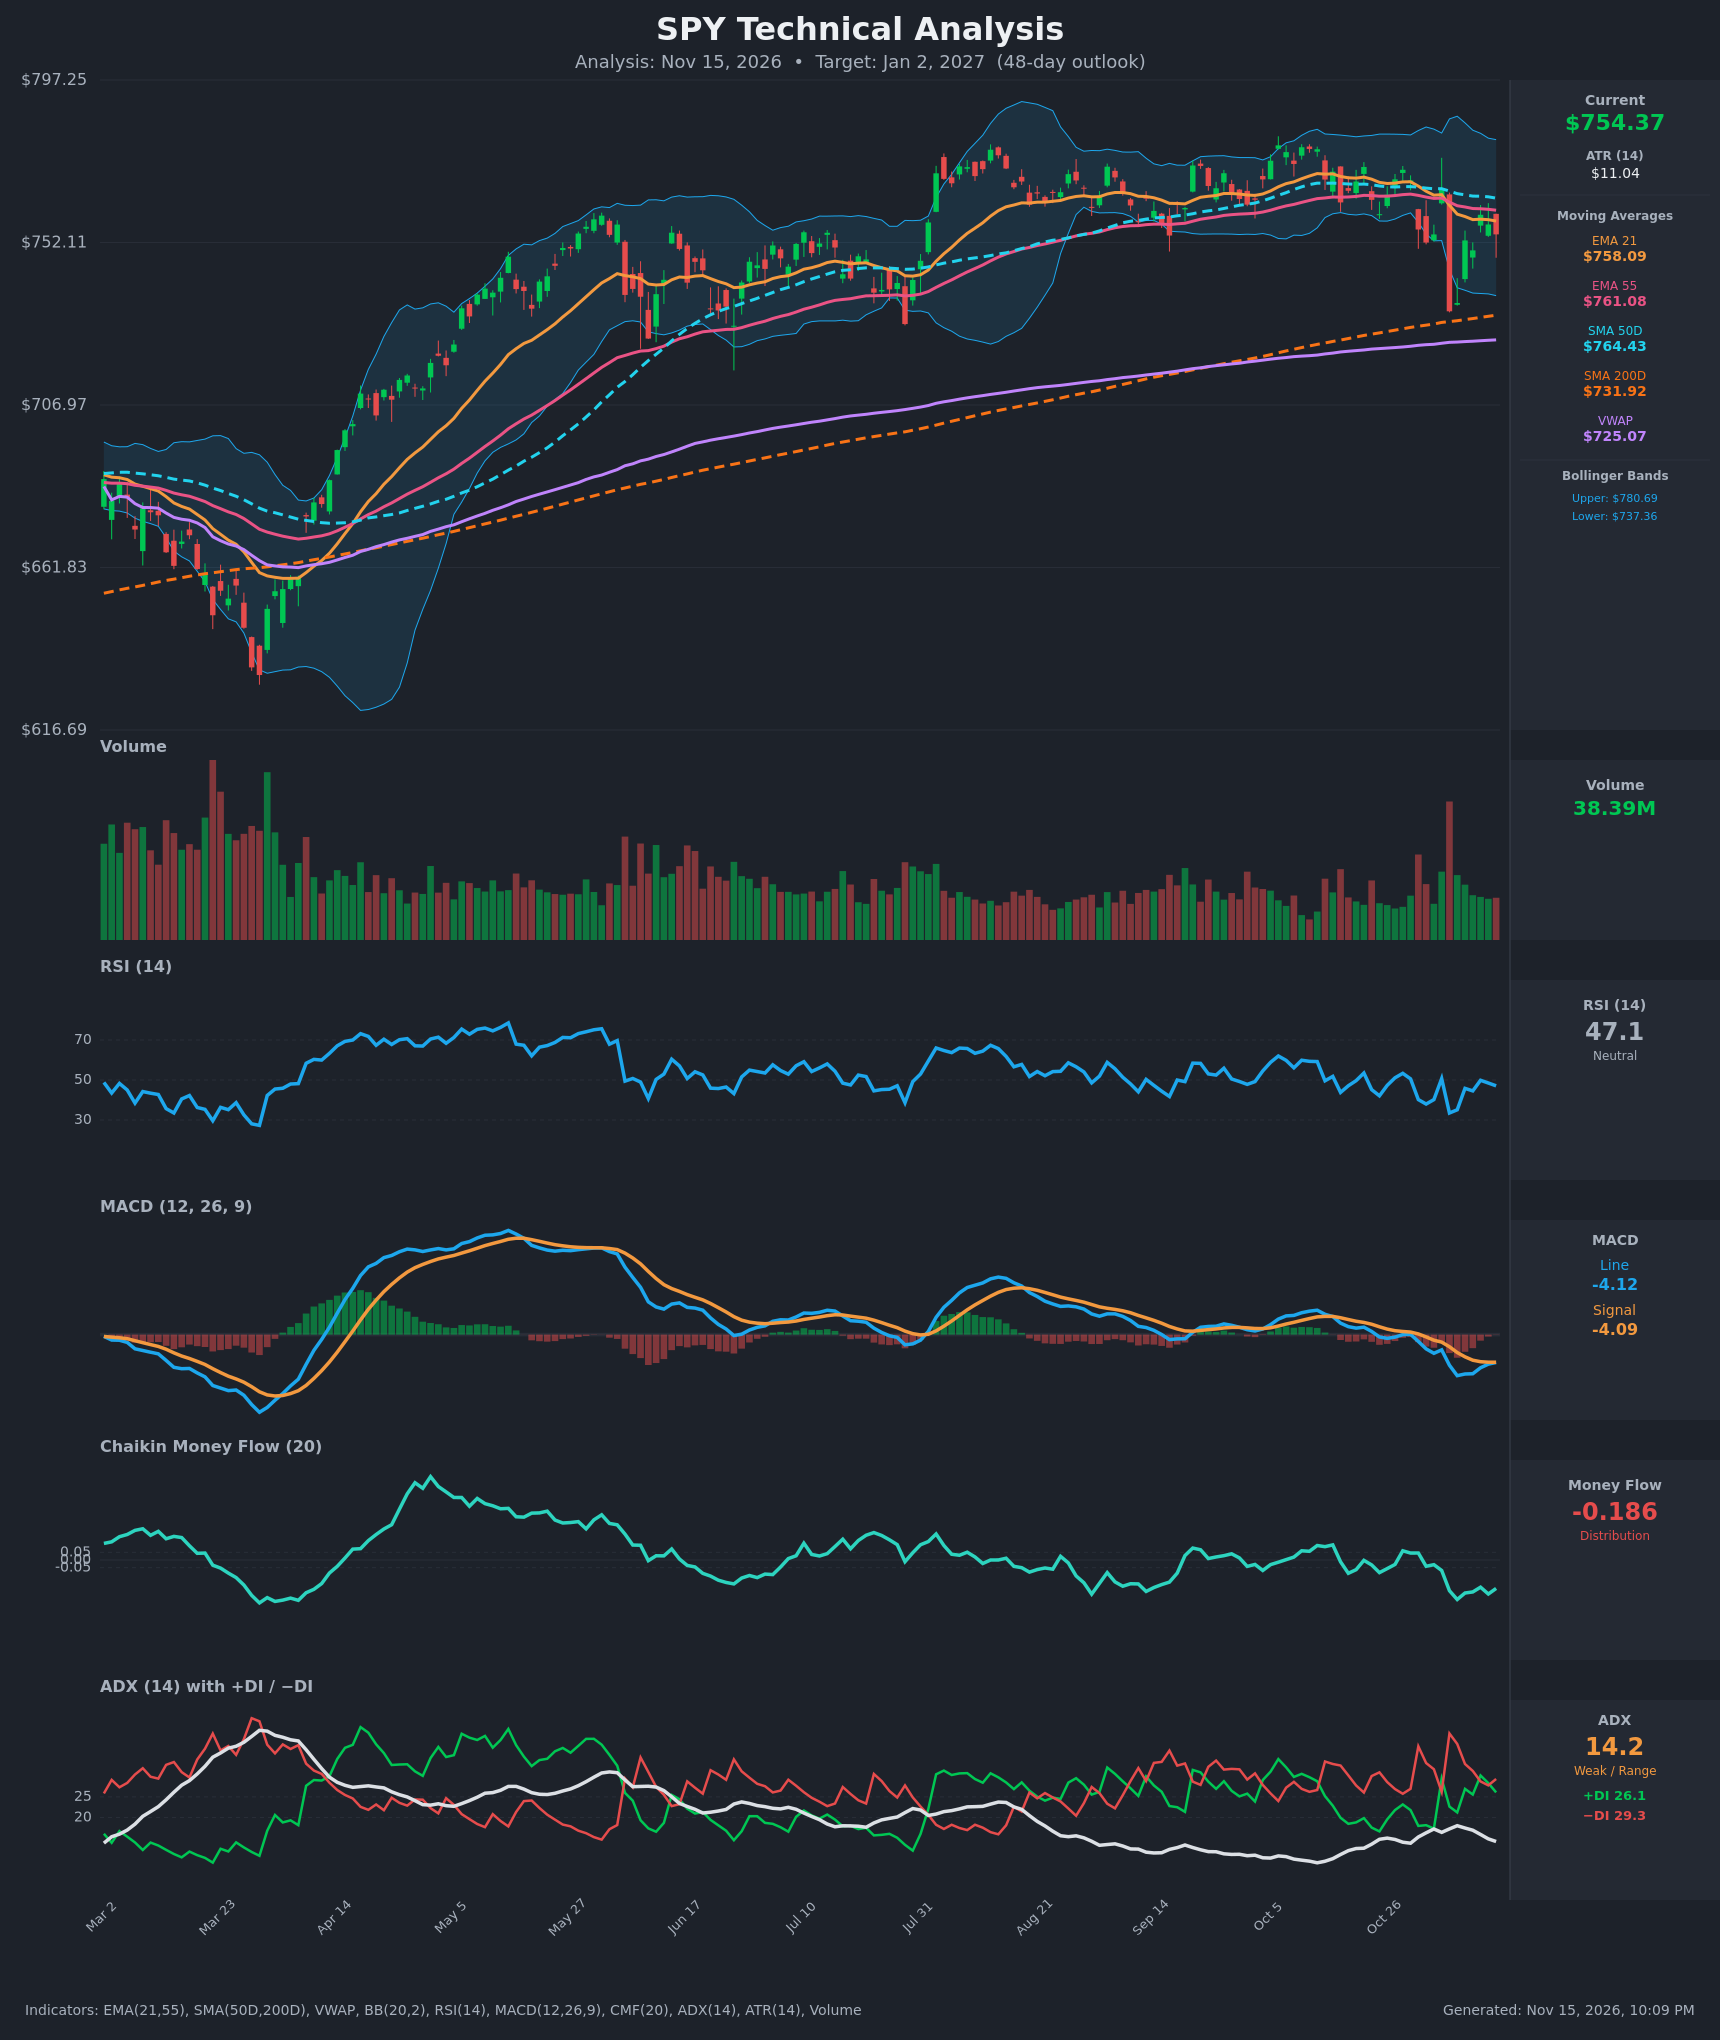
- RSI (14): 47.08, just under the 50 midline. It bounced from 33.5 on Nov 5 to 49.9 on Nov 11, then rolled over to 47. That is neutral momentum with a slight bearish tilt, since it cannot get back above 50. [Neutral]
- 20 EMA (EMA 21): $758.09, with price at $754.37 below it. EMA21 has been falling since Oct 28 (768.98 to 758.09) and now acts as near-term resistance. It is also below EMA55 ($761.08), a recent bearish EMA crossover (cross on ~Nov 5). [Bearish]
- MACD: Line -4.123 vs Signal -4.092, histogram about -0.03. The line has been below the signal since Oct 30 and is negative, but it is converging, so selling momentum is fading. A bullish re-cross is possible if price holds. [Bearish]
- Bollinger Bands (20): Upper $780.69, lower $737.36, midline about $759. Price sits in the lower half, below the midline, and the bands are fairly narrow after the Nov 5 flush. The lower band is near the Nov 5 low (~$733). [Neutral]
- CMF (20): -0.186, well below -0.05. It has been negative since Nov 4 and worsened to -0.26 on Nov 6, with no recovery. Sustained distribution suggests rallies are being sold. [Distribution]
- ADX (14): 14.2 with -DI (29.3) above +DI (26.1). The trend is weak or range-bound, but the DI edge favors bears. ADX has been drifting lower since mid-year, so there is no strong trend yet. [Weak Trend, bearish lean]
- Volume: 38.39M. Volume spiked on the Nov 5 breakdown candle (-4.4%, close $733) and has faded since. The rebound came on lower volume, which suggests a weak recovery. [Mildly Bearish]
Additional context from the supplied data:
- SMA 50D / SMA 200D: SMA50D is $764.43 and flattening or rolling over. SMA200D is $731.92 and rising. Price is above the SMA200D (long-term uptrend intact) but below the SMA50D. There is no death cross, and the 50 stays well above the 200.
- VWAP: $725.07, so price is above VWAP, meaning longer-term buyers are still in profit.
DIVERGENCES & TRENDS
- There is no clear RSI or MACD divergence. The Nov 5 low (733) had RSI at 33.5 and MACD at -6.08. The Nov 9-13 bounce shows MACD histogram improvement, but price is making lower highs (759.81 on Nov 11 vs 766.81 on Nov 4).
- CMF is making new lows even as price recovered from 733 to 754. That is a mild bearish divergence, with price recovering on weak buying pressure.
- The trend in the moving averages is deteriorating. Price has lost EMA21, EMA55 and SMA50D, and EMA21 crossed below EMA55. Price is still above the rising SMA200D and the rising VWAP.
- MACD is close to a bullish re-cross, so the short-term downside momentum is flattening.
- Directional movement is near parity (+DI 26.1 vs -DI 29.3) and ADX is at 14. That is a choppy regime, but the balance leans slightly toward sellers.
CHART PATTERNS
- Broad range / rectangle with a bearish double-top flavor: Since July, SPY has been in a roughly $733-$780 range, with highs in the Sept-Oct zone near $775-$780 (the upper Bollinger Band area). The failed push higher and the sharp Nov 5 drop resemble a Bearish Double Top, with the "neckline" at about $733-$737.
- Confirmation is incomplete: Price bounced from the neckline rather than closing below it. A decisive close below $733 (also the SMA200D at $731.92) would confirm a double-top and imply a measured move of roughly range height ($780 - $733 = $47) to about $686-$700.
- Alternative: If the $733 area holds, the structure remains a Triple Top / range with a bullish reaction off the SMA200D, and a break above $780 would be needed to invalidate the bearish read.
- The ATR of $11.04 implies about $76 of typical 48-day volatility (ATR × √48 ≈ $76), which supports a wide range.
POTENTIAL SCENARIOS
- Scenario 1: Bearish Distribution Breakdown — Weak rallies fail at EMA21/EMA55 ($758-$761), CMF stays in distribution, and sellers push price back to test the Nov 5 low and SMA200D. A close below $731.92 confirms the double-top. Trigger: rejection at $758-$765 followed by a daily close below $733. Target: $733, then $705-$715 on a break. Invalidation: daily close above $765 (SMA50D) with CMF turning positive. (40% probability)
- Scenario 2: Neutral Range Chop — ADX stays below 20, and price oscillates between the SMA200D support area (~$733) and the SMA50D/EMA cluster (~$765). Trigger: MACD re-crosses up, RSI holds around 45-55. Target: $740-$765 range. Invalidation: close outside $730-$780. (28% probability)
- Scenario 3: Bullish Recovery to Range High — Buyers defend $733-$737 again, MACD crosses up, and price reclaims the SMA50D with a push toward the upper band. Trigger: daily close above $765 on rising volume and CMF back above 0. Target: $780-$790. Invalidation: close below $733. (32% probability)
PRICE TARGETS
For the 48-day horizon (target date ~Jan 2, 2027):
- Target Price: $741.00
- Expected Range: $702.00 to $795.00 (width $93 ≈ 12.3% of current price, consistent with the 30-60 day guidance)
- Key Levels: Support at $733.00 (Nov 5 low / SMA200D at $731.92), Resistance at $764.43 (SMA50D, with EMA21/EMA55 at $758-$761 just below)
OVERALL BIAS
OVERALL BIAS: BEARISH - Price is below the EMA21, EMA55 and SMA50D, MACD is negative and below its signal, -DI is above +DI, and CMF at -0.186 shows persistent distribution with a double-top-style structure under $780. The long-term uptrend (above a rising SMA200D) and the weak ADX limit conviction, so I expect a drift toward the $733 support zone rather than a collapse.
This is educational analysis and not financial advice.